OPEN-SOURCE SCRIPT
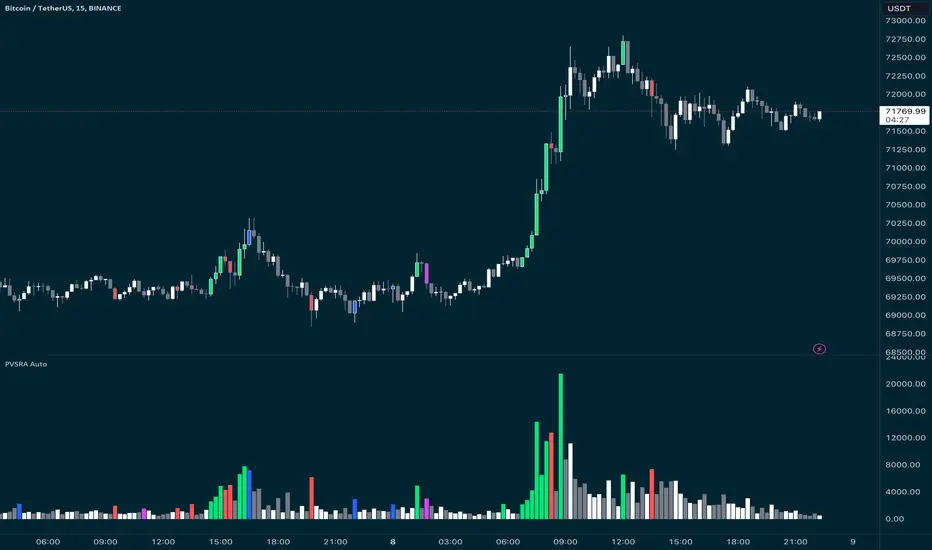
PVSRA Candles Auto Override

What does this “PVSRA Candles Auto Override” Indicator
do?
This indicator automates PVSRA analysis for crypto traders. It finds the corresponding Binance Perpetual Futures chart for the current instrument, then replaces the current chart's volume profile with the perpetual futures data (if available) to ensure the PVSRA calculation uses the most relevant volume. This not only reduces human error during market scans but also automatically selects the appropriate Binance Perpetual Futures contract, saving time and improving the accuracy of PVSRA calculations.
How can a trader use this indicator?
This helps the trader to identify if there is volume data available in an equivalent Binance Perpetual Futures chart and automatically displays it, making it easier to switch coins whilst viewing the market. Why do we want to use Binance Perpetual Futures Volume? In most markets Binance volume surpasses those of other crypto exchanges so this will give us a better view on the volume spikes in the market.
What is PVSRA and how can I trade using this indicator?
PVSRA candles are a type of candlestick chart formatting. PVSRA stands for Price, Volume, Support and Resistance Analysis.
Here's a breakdown of what PVSRA candles aim to achieve:
Combine multiple factors: They take into account price movement, trading volume, and support and resistance levels to identify potential trading opportunities.
Highlight potential imbalances: By color-coding candles based on PVSRA analysis, they aim to show areas of high volume activity, potentially representing imbalances created by market makers (large institutions that influence price).
Identify areas of revisit: The theory is that these high-volume zones may be revisited by the market in the future, as there's "unrecovered liquidity" in those areas.
Usage of the Indicator:
By default the indicator will automatically use the Equivalent Binance Perpetual Chart for the Data
You can override the symbol manually if you what to view another instrument’s data.
開源腳本
秉持TradingView一貫精神,這個腳本的創作者將其設為開源,以便交易者檢視並驗證其功能。向作者致敬!您可以免費使用此腳本,但請注意,重新發佈代碼需遵守我們的社群規範。
免責聲明
這些資訊和出版物並非旨在提供,也不構成TradingView提供或認可的任何形式的財務、投資、交易或其他類型的建議或推薦。請閱讀使用條款以了解更多資訊。
開源腳本
秉持TradingView一貫精神,這個腳本的創作者將其設為開源,以便交易者檢視並驗證其功能。向作者致敬!您可以免費使用此腳本,但請注意,重新發佈代碼需遵守我們的社群規範。
免責聲明
這些資訊和出版物並非旨在提供,也不構成TradingView提供或認可的任何形式的財務、投資、交易或其他類型的建議或推薦。請閱讀使用條款以了解更多資訊。