OPEN-SOURCE SCRIPT
已更新 Auto Last Earnings AVWAP
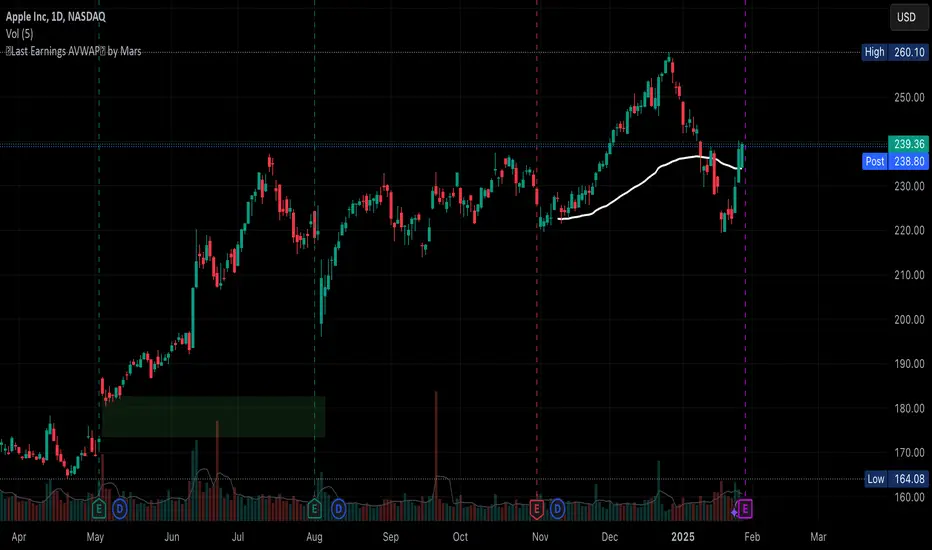
This script provides an automated approach to tracking critical post-earnings price levels. You can add it to a chart and then flip through your watchlist to see the anchored AVWAPs without the need to do it manually one by one.
Core Features:
- Automatically detects earnings dates and anchors VWAP calculations without manual input
- Calculates volume-weighted average price specifically from the last earnings release
- Identifies and visualizes significant earnings gaps between reporting periods
Volume-Based Signal Detection:
- Monitors VWAP crosses with volume confirmation (requires 1.5x normal volume)
- Labels high-volume breakouts with clear directional signals
- Uses a 6-bar adaptive volume baseline to filter out noise
Practical Applications:
AVWAP anchored at earnings offers a great price support level that should be considered when deciding to buy/sell the stock. This script eliminates manual VWAP anchoring and reduces chart management time
Key Differentiators:
First note: coding VWAP anchoring in pine is more challenging that one would think. The source code is open to help other users and hopefully inspire different applications.
- No need to manually anchor the VWAP
- Draws earnings gap from earnings to earnings (if auto mode)
- Detects breakouts through the AVWAP line
發行說明
Better description attempt:The Last Earnings AVWAP indicator combines post-earnings price analysis with volume-weighted mechanics to help traders identify institutional support and resistance levels that often form after earnings releases.
Trading Logic & Methodology:
This indicator tracks how price interacts with the volume-weighted average price (VWAP) specifically anchored from earnings dates, which often represent key inflection points where institutional traders reassess their positions. By automatically detecting earnings dates and calculating VWAP from these points, it identifies price levels where large players may have established significant positions.
Technical Implementation:
Uses earnings dates as anchor points to calculate VWAP, resetting calculations after each release
Implements adaptive volume analysis using a 6-bar rolling window to identify genuine breakouts
Requires 1.5x normal volume for signal confirmation, filtering out low-volume noise
Automatically detects and visualizes earnings gaps, providing context for post-earnings price movements
Why This Matters for Trading:
Post-earnings VWAP levels often act as self-fulfilling support/resistance zones because:
This script will save you a lot of time:
No need to manually find earnings and anchor the VWAP.
Advanced Features:
Dynamic gap visualization adjusts to the typical duration between earnings
Combines price, volume, and earnings data to generate high-probability trade signals
Includes four types of alerts for VWAP crosses and high-volume breakouts
開源腳本
秉持TradingView一貫精神,這個腳本的創作者將其設為開源,以便交易者檢視並驗證其功能。向作者致敬!您可以免費使用此腳本,但請注意,重新發佈代碼需遵守我們的社群規範。
Cyclist, Trader, Technologist. Get access to data for my options indicators on smartcanvas.com for free via bots
免責聲明
這些資訊和出版物並非旨在提供,也不構成TradingView提供或認可的任何形式的財務、投資、交易或其他類型的建議或推薦。請閱讀使用條款以了解更多資訊。
開源腳本
秉持TradingView一貫精神,這個腳本的創作者將其設為開源,以便交易者檢視並驗證其功能。向作者致敬!您可以免費使用此腳本,但請注意,重新發佈代碼需遵守我們的社群規範。
Cyclist, Trader, Technologist. Get access to data for my options indicators on smartcanvas.com for free via bots
免責聲明
這些資訊和出版物並非旨在提供,也不構成TradingView提供或認可的任何形式的財務、投資、交易或其他類型的建議或推薦。請閱讀使用條款以了解更多資訊。