OPEN-SOURCE SCRIPT
EMA Multi Currency Radar
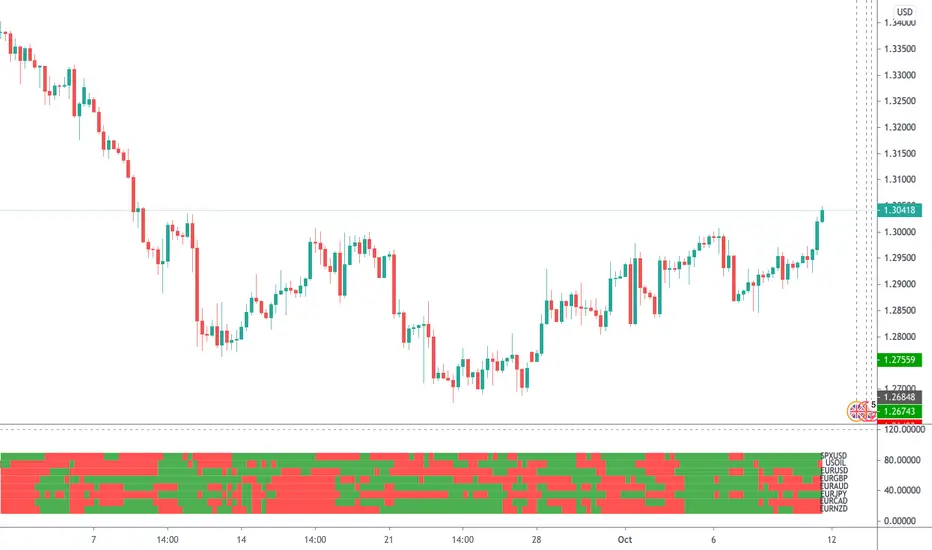
A simple indicator that illustrates where close price is in comparison to an MA. Just click the configure box and type in the EMA you want to monitor. The default is the 8 EMA .
To read the indictor:
- Green Line - Close price is above the EMA
- Red Line - Close price is below the EMA .
If you wish to have this indicator customised, please do not hesitate to contact me.
To read the indictor:
- Green Line - Close price is above the EMA
- Red Line - Close price is below the EMA .
If you wish to have this indicator customised, please do not hesitate to contact me.
開源腳本
秉持TradingView一貫精神,這個腳本的創作者將其設為開源,以便交易者檢視並驗證其功能。向作者致敬!您可以免費使用此腳本,但請注意,重新發佈代碼需遵守我們的社群規範。
免責聲明
這些資訊和出版物並非旨在提供,也不構成TradingView提供或認可的任何形式的財務、投資、交易或其他類型的建議或推薦。請閱讀使用條款以了解更多資訊。
開源腳本
秉持TradingView一貫精神,這個腳本的創作者將其設為開源,以便交易者檢視並驗證其功能。向作者致敬!您可以免費使用此腳本,但請注意,重新發佈代碼需遵守我們的社群規範。
免責聲明
這些資訊和出版物並非旨在提供,也不構成TradingView提供或認可的任何形式的財務、投資、交易或其他類型的建議或推薦。請閱讀使用條款以了解更多資訊。