PROTECTED SOURCE SCRIPT
Daily Range Exhaustion Signal
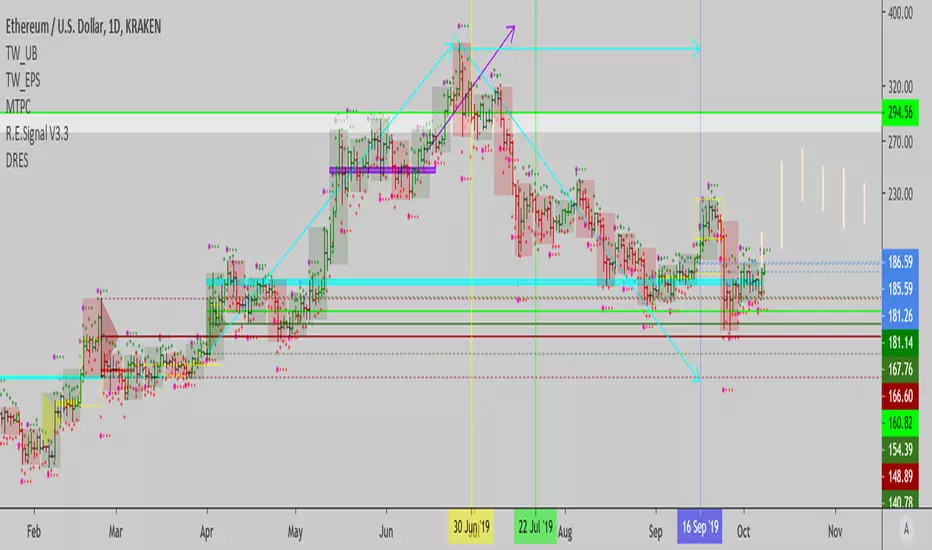
This tool plots the average true range distance from each bar's open, up and down, so you can tell when a bar moves by more than the average distance a day's range usually travels. It's an interesting concept, but not something I use a lot of the time. Looking at the range relative to the last bar's range, is what I normally do to find bouts of strength or weakness, and to determine if these moves have follow through or not.
You may experiment with this indicator to see if it helps in your price action analysis. Usually, bigger than 1 ATR moves don't keep going for much more, unless there's some outrageous news related to the move.
This idea came from a conversation with Yacine Kanoun here, and I coded it into an indicator.
Credit where credit is due (right Yacine?)...
Cheers,
Ivan Labrie.
受保護腳本
此腳本以閉源形式發佈。 不過,您可以自由且不受任何限制地使用它 — 在此處了解更多資訊。
🔒Want to dive deeper? Check out my paid services below🔒
linktr.ee/ivanlabrie
linktr.ee/ivanlabrie
免責聲明
這些資訊和出版物並不意味著也不構成TradingView提供或認可的金融、投資、交易或其他類型的意見或建議。請在使用條款閱讀更多資訊。
受保護腳本
此腳本以閉源形式發佈。 不過,您可以自由且不受任何限制地使用它 — 在此處了解更多資訊。
🔒Want to dive deeper? Check out my paid services below🔒
linktr.ee/ivanlabrie
linktr.ee/ivanlabrie
免責聲明
這些資訊和出版物並不意味著也不構成TradingView提供或認可的金融、投資、交易或其他類型的意見或建議。請在使用條款閱讀更多資訊。