OPEN-SOURCE SCRIPT
Financial-Conditions Brake Index (FCBI) — US10Y brake on USIRYY
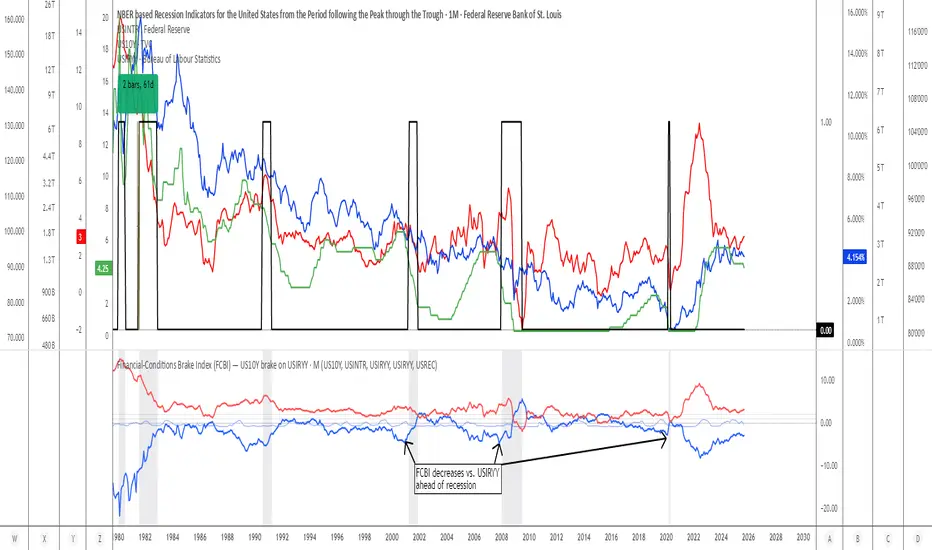
Financial-Conditions Brake Index (FCBI) – US10Y Brake on USIRYY
Concept
The Financial-Conditions Brake Index (FCBI) measures how U.S. long-term yields (US10Y) interact with the Federal Funds Rate (USINTR) and inflation (CPI YoY) to shape real-rate conditions (USIRYY).
It visualizes whether the bond market is tightening or loosening overall financial conditions relative to the Federal Reserve’s policy stance.
Formula
FCBI = (US10Y) − (USINTR) − (CPI YoY)
How It Works
The FCBI expresses the difference between the long-term yield curve and short-term policy rates, adjusted for inflation. It shows whether the long end of the curve is amplifying or counteracting the Fed’s stance.
FCBI > +2 → Strong brake → Long yields remain elevated despite easing → tight conditions → recession delayed.
FCBI +1 to +2 → Mild brake → Financial transmission slower; lag ≈ 12–18 months.
FCBI 0 to +1 → Neutral → Typical early post-cut environment.
FCBI < 0 → Accelerator → Long yields and inflation expectations falling → liquidity flows freely → recession often follows within 6–14 months.
How to Read the Chart
Blue line (FCBI) shows the strength of the financial brake.
Red line (USIRYY) represents the real yield baseline.
Recession shading (gray) marks NBER recessions for comparison.
FCBI < USIRYY → Brake engaged → financial conditions tighter than real-rate baseline.
FCBI > USIRYY → Brake released → long end easing faster than policy → liquidity surge → late-cycle setup.
Historically, U.S. recessions begin on average about 14 months after the first Fed rate cut, and a decline of the FCBI below zero often precedes that window.
Practical Use
Use the FCBI to identify when policy transmission is blocked (brake engaged) or flowing (brake released).
Cross-check with yield-curve inversions, Fed policy shifts, and inflation expectations to estimate macro timing windows.
Current Example (Oct 2025)
FCBI ≈ −3.1, USIRYY ≈ +3.0 → Brake still engaged.
Once FCBI rises above USIRYY and crosses positive, it signals the “brake released” phase — historically the final liquidity surge before a U.S. recession.
Summary
FCBI shows how tight the brake is.
USIRYY shows how fast the car is moving.
When FCBI rises above USIRYY, the brake is released — liquidity accelerates and the historical recession countdown begins.
開源腳本
秉持TradingView一貫精神,這個腳本的創作者將其設為開源,以便交易者檢視並驗證其功能。向作者致敬!您可以免費使用此腳本,但請注意,重新發佈代碼需遵守我們的社群規範。
免責聲明
這些資訊和出版物並非旨在提供,也不構成TradingView提供或認可的任何形式的財務、投資、交易或其他類型的建議或推薦。請閱讀使用條款以了解更多資訊。
免責聲明
這些資訊和出版物並非旨在提供,也不構成TradingView提供或認可的任何形式的財務、投資、交易或其他類型的建議或推薦。請閱讀使用條款以了解更多資訊。