INVITE-ONLY SCRIPT
已更新 (1-20)Dashboard trendlines Price
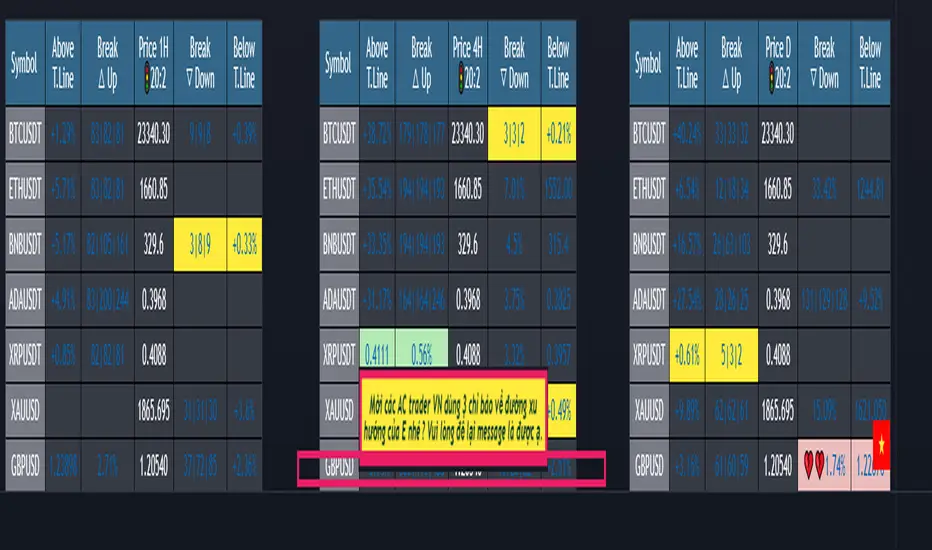
This is a script about 20 trading pairs with trendline.
-on each chart of a trading pair, there is only one trendline pair: 1 uptrendline and 1 downtrendline
-so when the statistics on the table also show the column of the uptrend and the column of the downtrend
-When the price approaches any trendline but the ratio is 1%, that trendline will be colored blue (downtrend), red (uptrend)
-the column above T.line(below T.line) is the value of the current trendline compared to the closing price of the candle
-The Break up (Break down) column when the price breaks will show the green heart (break up), the red heart break (break down) and the percentage value when breaking through the point of the trendline.
-price column is the current price of the candle
-especially when a candle has closed above the trendline (assuming an uptrend), then from the 2nd tree to the current , it will count according to memory so that traders know when the price broke, and how many candles already.
-The breakdown parameter is displayed (for example, 3|8|10), which means that the price has broken through 10 candles, of which 8 trees are closing above the breakout point, and the last 3 are closing above. break point
-In addition, when displaying 3 parameters as above, the next column (above/below T.line) will display the percentage from when the price breaks that point to the current price of the candle.
-you can change the time in Resolution indicator settings to show multiple time arcs
Thank you everyone for your interest and trust
- 5 pairs are free for traders :


---------------------------------------------------------------------------------
Vietnamese
Đây là script về bảng thống kê 20 cặp giao dịch với đường trendline .
-trên mỗi biểu đồ của cặp giao dịch chỉ tồn tại duy nhất 1 cặp trendline là: 1trendline tăng và 1 trendline giảm
-vì vậy khi thống kê trên bảng cũng hiển thị cột của trend tăng và cột của trend giảm
-khi giá tiến gần đến 1 đường trendline bất kì mà tỉ lệ còn 1% thì đường trendline đó tô màu xanh(trend giảm) ,màu đỏ(trend tăng)
-cột above T.line(below T.line) là giá trị của đường trendline hiện tại so với giá đóng cửa của nến
-cột Break up(Break down) khi giá phá vỡ sẽ thể thiện trái tim xanh(phá vỡ lên),trái tim đỏ vỡ(phá vỡ xuống) và giá trị phần trăm khi phá qua điểm của trendline.
-cột giá là giá hiện tại của nến
-đặc biệt khi 1 cây nến đã đóng cửa trên đường trendline(giả sử trend tăng) thì từ cây thứ 2 đến hiện tại nó sẽ đếm theo bộ nhớ để các trader biết được giá đã phá khi nào,và qua bao nhiêu nến rồi.
-thông số khi phá vỡ hiển thị (ví dụ là 3|8|10) thì hiểu là giá đã phá vỡ qua 10 nến, trong đó có 8 cây đóng cửa trên điểm phá vỡ,và 3 cây gần nhất đang đóng cửa trên điểm phá vỡ
-ngoài ra khi hiện 3 thông số như trên thì cột bên cạnh (above/below T.line) sẽ hiển thị được số phần trăm tính từ khi giá phá vỡ điểm đó đến giá hiện tại của cây nến.
-các bạn có thể thay đổi thời gian trong cài đặt chỉ báo Resolution để hiển thị nhiều cung thời gian
Cảm ơn mọi người đã quan tâm và tin dùng
-on each chart of a trading pair, there is only one trendline pair: 1 uptrendline and 1 downtrendline
-so when the statistics on the table also show the column of the uptrend and the column of the downtrend
-When the price approaches any trendline but the ratio is 1%, that trendline will be colored blue (downtrend), red (uptrend)
-the column above T.line(below T.line) is the value of the current trendline compared to the closing price of the candle
-The Break up (Break down) column when the price breaks will show the green heart (break up), the red heart break (break down) and the percentage value when breaking through the point of the trendline.
-price column is the current price of the candle
-especially when a candle has closed above the trendline (assuming an uptrend), then from the 2nd tree to the current , it will count according to memory so that traders know when the price broke, and how many candles already.
-The breakdown parameter is displayed (for example, 3|8|10), which means that the price has broken through 10 candles, of which 8 trees are closing above the breakout point, and the last 3 are closing above. break point
-In addition, when displaying 3 parameters as above, the next column (above/below T.line) will display the percentage from when the price breaks that point to the current price of the candle.
-you can change the time in Resolution indicator settings to show multiple time arcs
Thank you everyone for your interest and trust
- 5 pairs are free for traders :
---------------------------------------------------------------------------------
Vietnamese
Đây là script về bảng thống kê 20 cặp giao dịch với đường trendline .
-trên mỗi biểu đồ của cặp giao dịch chỉ tồn tại duy nhất 1 cặp trendline là: 1trendline tăng và 1 trendline giảm
-vì vậy khi thống kê trên bảng cũng hiển thị cột của trend tăng và cột của trend giảm
-khi giá tiến gần đến 1 đường trendline bất kì mà tỉ lệ còn 1% thì đường trendline đó tô màu xanh(trend giảm) ,màu đỏ(trend tăng)
-cột above T.line(below T.line) là giá trị của đường trendline hiện tại so với giá đóng cửa của nến
-cột Break up(Break down) khi giá phá vỡ sẽ thể thiện trái tim xanh(phá vỡ lên),trái tim đỏ vỡ(phá vỡ xuống) và giá trị phần trăm khi phá qua điểm của trendline.
-cột giá là giá hiện tại của nến
-đặc biệt khi 1 cây nến đã đóng cửa trên đường trendline(giả sử trend tăng) thì từ cây thứ 2 đến hiện tại nó sẽ đếm theo bộ nhớ để các trader biết được giá đã phá khi nào,và qua bao nhiêu nến rồi.
-thông số khi phá vỡ hiển thị (ví dụ là 3|8|10) thì hiểu là giá đã phá vỡ qua 10 nến, trong đó có 8 cây đóng cửa trên điểm phá vỡ,và 3 cây gần nhất đang đóng cửa trên điểm phá vỡ
-ngoài ra khi hiện 3 thông số như trên thì cột bên cạnh (above/below T.line) sẽ hiển thị được số phần trăm tính từ khi giá phá vỡ điểm đó đến giá hiện tại của cây nến.
-các bạn có thể thay đổi thời gian trong cài đặt chỉ báo Resolution để hiển thị nhiều cung thời gian
Cảm ơn mọi người đã quan tâm và tin dùng
發行說明
Updated title for easy recognition僅限邀請腳本
只有經作者批准的使用者才能訪問此腳本。您需要申請並獲得使用權限。該權限通常在付款後授予。如欲了解更多詳情,請依照以下作者的說明操作,或直接聯絡ichimoku14642。
除非您完全信任其作者並了解腳本的工作原理,否則TradingView不建議您付費或使用腳本。您也可以在我們的社群腳本中找到免費的開源替代方案。
作者的說明
Do you want to try 3 day Free? Please send me message with your request. Thank you!
提醒:在請求訪問權限之前,請閱讀僅限邀請腳本指南。
免責聲明
這些資訊和出版物並不意味著也不構成TradingView提供或認可的金融、投資、交易或其他類型的意見或建議。請在使用條款閱讀更多資訊。
僅限邀請腳本
只有經作者批准的使用者才能訪問此腳本。您需要申請並獲得使用權限。該權限通常在付款後授予。如欲了解更多詳情,請依照以下作者的說明操作,或直接聯絡ichimoku14642。
除非您完全信任其作者並了解腳本的工作原理,否則TradingView不建議您付費或使用腳本。您也可以在我們的社群腳本中找到免費的開源替代方案。
作者的說明
Do you want to try 3 day Free? Please send me message with your request. Thank you!
提醒:在請求訪問權限之前,請閱讀僅限邀請腳本指南。
免責聲明
這些資訊和出版物並不意味著也不構成TradingView提供或認可的金融、投資、交易或其他類型的意見或建議。請在使用條款閱讀更多資訊。