OPEN-SOURCE SCRIPT
MACD_STO-SAMI
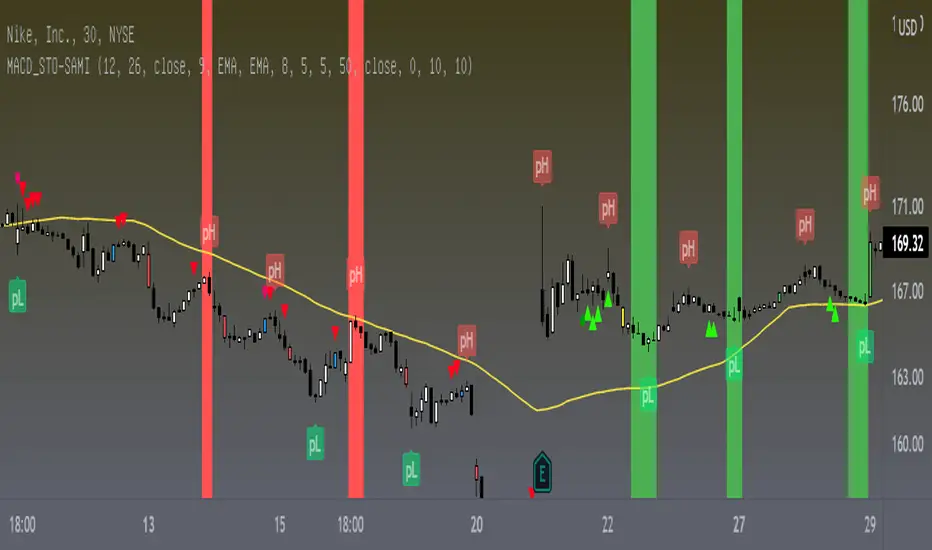
This indicator depends on the trend. You must first determine the general trend and then wait for the signals that indicate buying in the bullish direction and the signals that indicate selling in the bearish direction, which is the green signal is considered buying and the red signal is considered selling
Also, this indicator differs from the rest of the indicators that the signal is prior to the movement of hair, meaning that it is predictive and is strong.
The green bar is the buying peak.
The red bar is oversold.
The red arrows indicate that you can sell, but the price must be monitored.
The green arrows indicate that it is possible to buy and monitor the price
The colored candles are 4, and each candle indicates the order of the candle.
1- The blue candle indicates a change in the bearish trend and the possibility of it changing to an upward trend.
2- The green candle, which indicates that there will be acceleration in the upward direction.
3- The yellow candle indicates a change in the upward trend and the possibility of it changing to the downside.
4- The red candle indicates that there will be acceleration in the downside direction
To help determine the trend, the average of the 50 simple has been set
開源腳本
秉持TradingView一貫精神,這個腳本的創作者將其設為開源,以便交易者檢視並驗證其功能。向作者致敬!您可以免費使用此腳本,但請注意,重新發佈代碼需遵守我們的社群規範。
免責聲明
這些資訊和出版物並非旨在提供,也不構成TradingView提供或認可的任何形式的財務、投資、交易或其他類型的建議或推薦。請閱讀使用條款以了解更多資訊。
免責聲明
這些資訊和出版物並非旨在提供,也不構成TradingView提供或認可的任何形式的財務、投資、交易或其他類型的建議或推薦。請閱讀使用條款以了解更多資訊。