OPEN-SOURCE SCRIPT
已更新 [blackcat] L1 Old Duck Head
Level 1
Background
The old duck head is a classic form formed by a series of behaviors such as bankers opening positions, washing dishes, and pulling over the top of the duck head.
Function
A form of stock candles:
(1) Moving averages using 5, 10 and 60 parameters. When the 5-day and 10-day moving averages crossed the 60-day moving average, a duck neck was formed.
(2) The high point when the stock price fell back formed a duck head.
(3) When the stock price fell back soon, the 5-day and 10-day moving averages again turned up to form a duckbill.
(4) Duck nose refers to the hole formed when the 5-day moving average crosses the 10-day moving average and the two lines cross again.
Market significance:
(1) When the dealer starts to collect chips, the stock price rises slowly, and the 5-day and 10-day moving averages cross the 60-day moving average, forming a duck neck.
(2) When the stock price of the banker shakes the position and starts to pull back, the high point of the stock price forms the top of the duck's head.
(3) When the dealer builds a position again to collect chips, the stock price rises again, forming a duck bill.
Operation method:
(1) Buy when the 5-day and 10-day moving averages cross the 60-day moving average and form a duck neck.
(2) Buy on dips near the sesame point of trading volume near the duckbill.
(3) Intervene when the stock price crosses the top of the duck's head in heavy volume.
The top of the duck’s head should be a little far away from the 60-day moving average, otherwise it means that the dealer is not willing to open a position at this old duck’s head, and the bottom of the old duck’s head must be heavy. Small is better, nothing is the strongest! There must be a lot of sesame dots under the nostrils of the duck, otherwise it means that the dealer has poor control. There must be ventilation under the duck bill, the higher the ventilation, the better!
Remarks
Feedbacks are appreciated.
發行說明
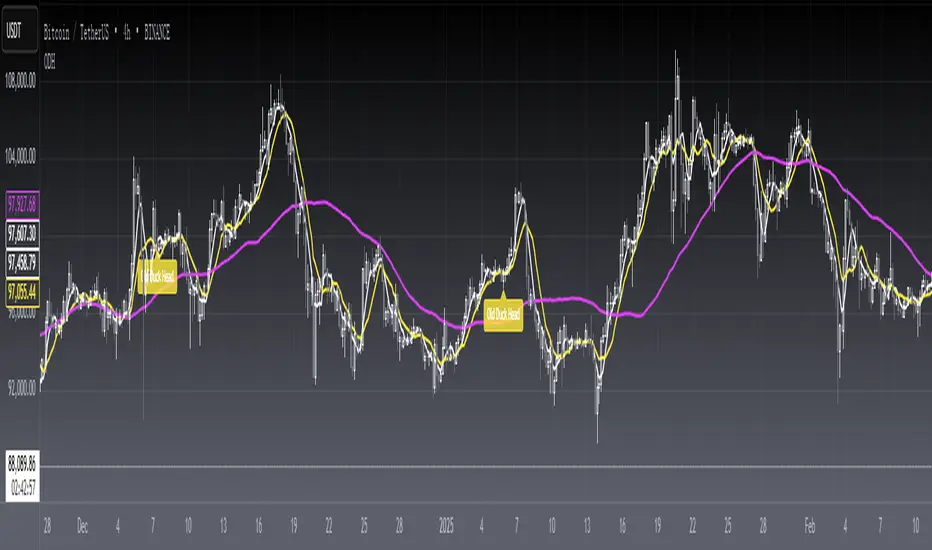
OVERVIEWThe L1 Old Duck Head indicator is a comprehensive trading tool designed to detect potential reversal patterns in financial markets. It combines multiple technical analysis components including moving averages and crossover patterns to identify bullish signals. The script uses three distinct moving averages (5-period, 10-period, and 60-period) to generate reliable entry points, making it particularly useful for traders looking to capitalize on market reversals.
FEATURES
• Dynamic Moving Averages: Three customizable MAs provide versatile trend identification:
Short-term MA (5-periods)
Medium-term MA (10-periods)
Long-term MA (60-periods)
• Pattern Recognition: Detects the "Old Duck Head" formation through specific conditions:
Crossovers between different MA periods
Consecutive cross-under checks
Price action analysis within defined ranges
• Signal Validation: Implements rigorous verification steps:
Checks for consecutive true conditions over a 5-bar period
Ensures proper relationship between MA crossovers
Validates price position relative to moving averages
HOW TO USE
Apply the indicator to your chart using the default settings.
Wait for the yellow "Old Duck Head" labels to appear, indicating potential buy signals.
Verify the signal strength by observing multiple consecutive occurrences.
Consider additional confirmation from other indicators before taking positions.
LIMITATIONS
⚠️ Please note:
The indicator may produce false signals during highly volatile market conditions.
Best suited for longer timeframe charts (Daily/Weekly).
Requires careful validation of signals before executing trades.
NOTES
This script was developed based on traditional technical analysis principles and should be used as part of a broader trading strategy. Always backtest thoroughly before applying to live markets.
THANKS
Special thanks to the TradingView community for providing valuable feedback and suggestions during development.
開源腳本
秉持TradingView一貫精神,這個腳本的創作者將其設為開源,以便交易者檢視並驗證其功能。向作者致敬!您可以免費使用此腳本,但請注意,重新發佈代碼需遵守我們的社群規範。
Avoid losing contact!Don't miss out! The first and most important thing to do is to join my Discord chat now! Click here to start your adventure: discord.com/invite/ZTGpQJq 防止失联,请立即行动,加入本猫聊天群: discord.com/invite/ZTGpQJq
免責聲明
這些資訊和出版物並非旨在提供,也不構成TradingView提供或認可的任何形式的財務、投資、交易或其他類型的建議或推薦。請閱讀使用條款以了解更多資訊。