OPEN-SOURCE SCRIPT
已更新 Linear Regression Volume Profile
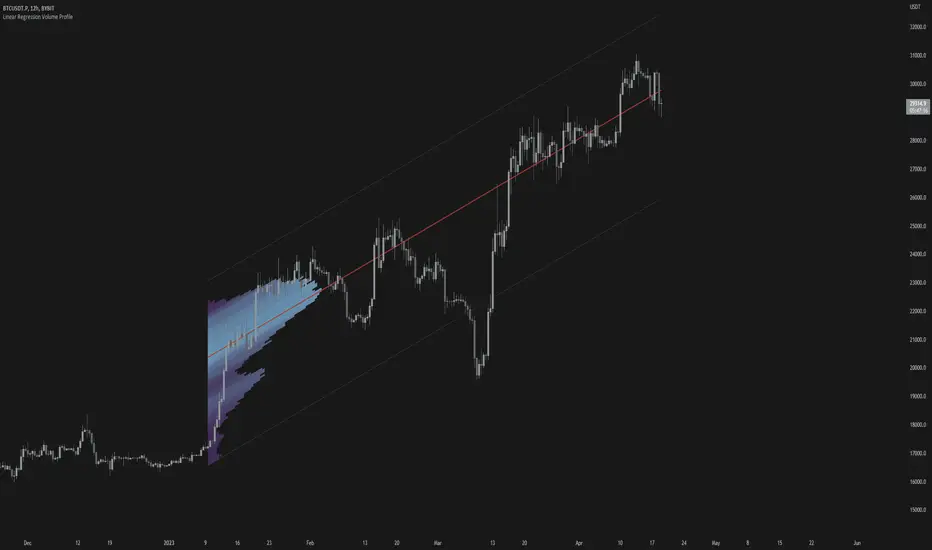
Linear Regression Volume Profile plots the volume profile fixated on the linear regression of the lookback period rather than statically across y = 0. This helps identify potential support and resistance inside of the price channel.
Settings
Linear Regression
Linear Regression
Usage
Similar to the traditional Linear Regression and Volume Profile this indicator is mainly to determine levels of support and resistance. One may interpret a level with high volume (i.e. point of control) to be a potential reversal point.
Details
This indicator first calculates the linear regression of the specified lookback period and, subsequently, the upper and lower bound of the linear regression channel. It then divides this channel by the specified number of rows and sums the volume that occurs in each row. The volume profile is scaled to the min and max volume.
Settings
Linear Regression
- Linear Regression Source: the price source in which to sample when calculating the linear regression
- Length: the number of bars to sample when calculating the linear regression
- Deviation: the number of standard deviations away from the linear regression line to draw the upper and lower bounds
Linear Regression
- Rows: the number of rows to divide the linear regression channel into when calculating the volume profile
- Show Point of Control: toggle whether or not to plot the level with highest amount of volume
Usage
Similar to the traditional Linear Regression and Volume Profile this indicator is mainly to determine levels of support and resistance. One may interpret a level with high volume (i.e. point of control) to be a potential reversal point.
Details
This indicator first calculates the linear regression of the specified lookback period and, subsequently, the upper and lower bound of the linear regression channel. It then divides this channel by the specified number of rows and sums the volume that occurs in each row. The volume profile is scaled to the min and max volume.
發行說明
- fixed bug regarding linear regression length being longer than bar_index
- updated chart
發行說明
- Fixed custom Point of Control color
開源腳本
秉持TradingView一貫精神,這個腳本的創作者將其設為開源,以便交易者檢視並驗證其功能。向作者致敬!您可以免費使用此腳本,但請注意,重新發佈代碼需遵守我們的社群規範。
免責聲明
這些資訊和出版物並非旨在提供,也不構成TradingView提供或認可的任何形式的財務、投資、交易或其他類型的建議或推薦。請閱讀使用條款以了解更多資訊。
免責聲明
這些資訊和出版物並非旨在提供,也不構成TradingView提供或認可的任何形式的財務、投資、交易或其他類型的建議或推薦。請閱讀使用條款以了解更多資訊。