PROTECTED SOURCE SCRIPT
Buy Sell Indicator by Independent Researcher
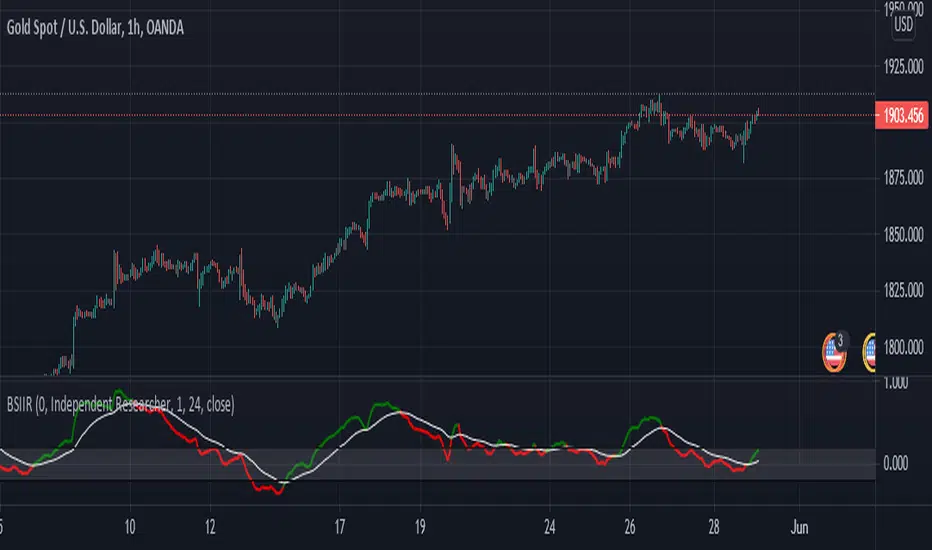
This is an Buy and Sell Oscillator. Its show the trend reversal or change in price action of the market. This indicator is a combination of various moving averages. This is like a MACD but a very powerful version.
How To Use It
Below you will see an example:-
XAUUSD

EURUSD

How To Use It
- If green line gives crossover white line towards down then price is expected to fall.
- If red line gives crossover white line towards up then price is expected to rise.
- For better results of indicator trade after closing of crossover candle.
- There is a band +.20 to -.20 for better results trade on crossover happens between that band.
Below you will see an example:-
XAUUSD
EURUSD
受保護腳本
此腳本以閉源形式發佈。 不過,您可以自由使用,沒有任何限制 — 點擊此處了解更多。
免責聲明
這些資訊和出版物並非旨在提供,也不構成TradingView提供或認可的任何形式的財務、投資、交易或其他類型的建議或推薦。請閱讀使用條款以了解更多資訊。
受保護腳本
此腳本以閉源形式發佈。 不過,您可以自由使用,沒有任何限制 — 點擊此處了解更多。
免責聲明
這些資訊和出版物並非旨在提供,也不構成TradingView提供或認可的任何形式的財務、投資、交易或其他類型的建議或推薦。請閱讀使用條款以了解更多資訊。