OPEN-SOURCE SCRIPT
已更新 Relative Performance
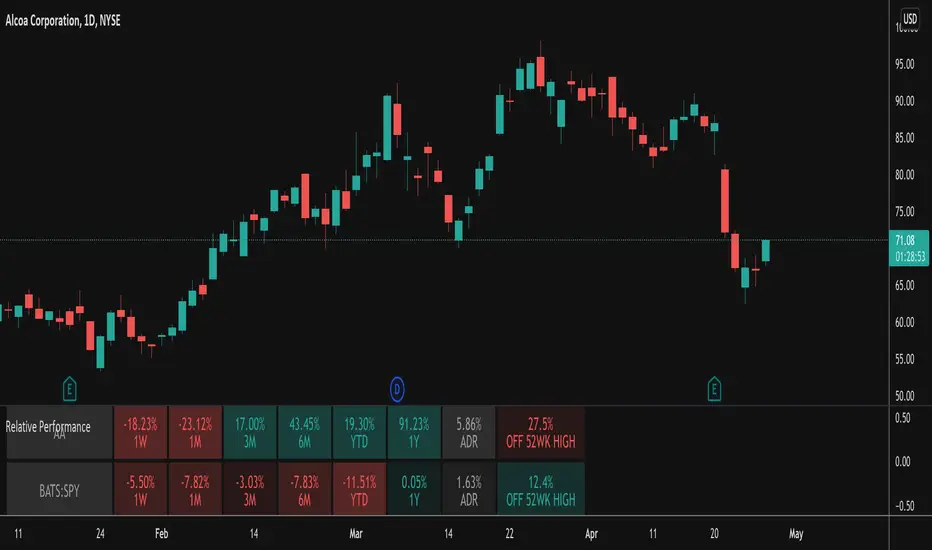
This indicator takes the Performance Table from BeeHolder and converts it to a Relative Performance table so you can compare the current chart vs. an Index (or whatever other ticker you want) to see the relative performance of one vs. the other. I also added a cell for ADR, which is also the same value as "Monthly Volatility" in the stock screener. This can be useful when screening stocks based on performance and volatility.
發行說明
Conversion to Pine v5Added a box to the table that looks at the distance from the 52 week high. The idea behind this is that the strongest stocks will be close to their highs and that's what you should focus on. I've coded it so that if a stock is within 25% of its 52 week high the color will be green indicating a good candidate.
發行說明
Changed the calculation for distance from the 52 week high to be the drawdown off the high instead of the percentage required to get back to the high as I think this is what people usually refer to when talking about this metric.開源腳本
秉持TradingView一貫精神,這個腳本的創作者將其設為開源,以便交易者檢視並驗證其功能。向作者致敬!您可以免費使用此腳本,但請注意,重新發佈代碼需遵守我們的社群規範。
免責聲明
這些資訊和出版物並非旨在提供,也不構成TradingView提供或認可的任何形式的財務、投資、交易或其他類型的建議或推薦。請閱讀使用條款以了解更多資訊。
免責聲明
這些資訊和出版物並非旨在提供,也不構成TradingView提供或認可的任何形式的財務、投資、交易或其他類型的建議或推薦。請閱讀使用條款以了解更多資訊。