OPEN-SOURCE SCRIPT
WaveTrend MultiEMA
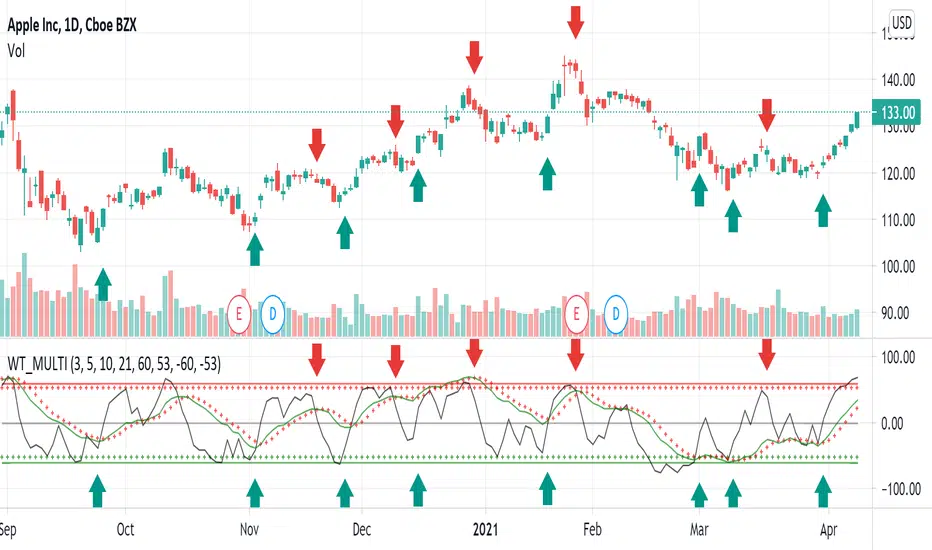
This is a modification of LazyBear's WaveTrend. The SMA trend has been removed and a shorter time frame EMA has been added in black. The idea is to buy when the shorter time frame starts to curl up and the longer time frame, green, has started to either flatten out or curl up too. Sell when the shorter time frame has started down and green has either flattened or bottomed out as well. The black line will generate some noise so the key is to use the two in combination. My final goal would be to have the green line looking at daily candles and the black line looking at a 2 or 4 hour candle, but I haven't figured out how to do that.
開源腳本
秉持TradingView一貫精神,這個腳本的創作者將其設為開源,以便交易者檢視並驗證其功能。向作者致敬!您可以免費使用此腳本,但請注意,重新發佈代碼需遵守我們的社群規範。
免責聲明
這些資訊和出版物並非旨在提供,也不構成TradingView提供或認可的任何形式的財務、投資、交易或其他類型的建議或推薦。請閱讀使用條款以了解更多資訊。
免責聲明
這些資訊和出版物並非旨在提供,也不構成TradingView提供或認可的任何形式的財務、投資、交易或其他類型的建議或推薦。請閱讀使用條款以了解更多資訊。