OPEN-SOURCE SCRIPT
Mirrored Buy/Sell Volume + Cumulative Delta
User Guide: Mirrored Buy/Sell Volume (Histogram)
🔍 What It Does
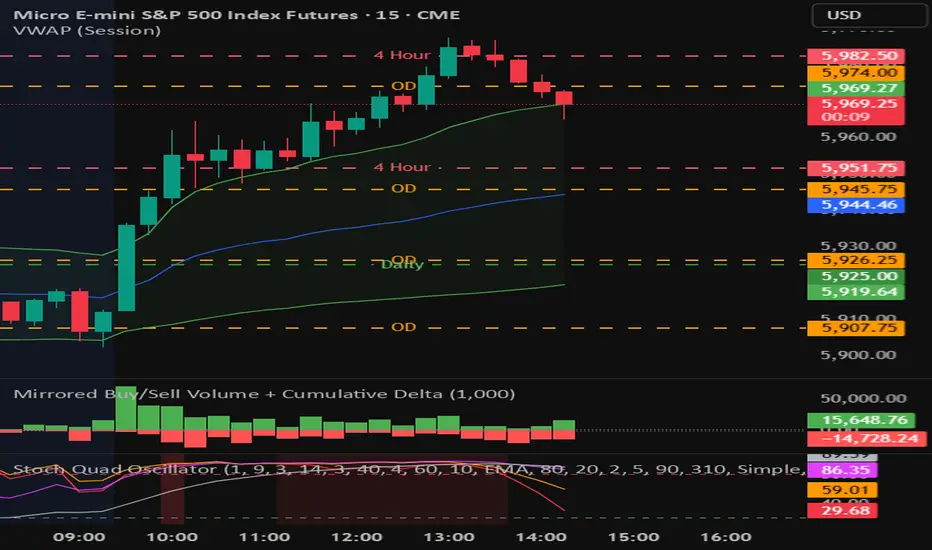
Displays green bars above zero for estimated buy volume
Displays red bars below zero for estimated sell volume
Adds a blue line showing Cumulative Delta (buy − sell over time)
Optional threshold lines help spot when net momentum builds up
📊 How Volume is Estimated
Same estimation method as the table version:
Buy Volume is proportion of volume estimated using (close - low) / (high - low)
Sell Volume is remainder of the total volume
Cumulative Delta = running total of (Buy − Sell) volume
This gives you:
A real-time sense of which side is gradually gaining control
More context than looking at candles or volume bars alone
✅ Best For
Visual trade decision support: who’s winning the tug-of-war?
Spotting trend initiation or momentum shifts
Combining with oscillator/trend tools for confirmation
⚠️ Limitations
Still an approximation — not based on actual trade aggressor data
Cannot separate passive vs. aggressive orders
Cumulative Delta does not reset unless specifically coded to do so
May mislead if the bar has long wicks or closes near midpoint
🔍 What It Does
Displays green bars above zero for estimated buy volume
Displays red bars below zero for estimated sell volume
Adds a blue line showing Cumulative Delta (buy − sell over time)
Optional threshold lines help spot when net momentum builds up
📊 How Volume is Estimated
Same estimation method as the table version:
Buy Volume is proportion of volume estimated using (close - low) / (high - low)
Sell Volume is remainder of the total volume
Cumulative Delta = running total of (Buy − Sell) volume
This gives you:
A real-time sense of which side is gradually gaining control
More context than looking at candles or volume bars alone
✅ Best For
Visual trade decision support: who’s winning the tug-of-war?
Spotting trend initiation or momentum shifts
Combining with oscillator/trend tools for confirmation
⚠️ Limitations
Still an approximation — not based on actual trade aggressor data
Cannot separate passive vs. aggressive orders
Cumulative Delta does not reset unless specifically coded to do so
May mislead if the bar has long wicks or closes near midpoint
開源腳本
秉持TradingView一貫精神,這個腳本的創作者將其設為開源,以便交易者檢視並驗證其功能。向作者致敬!您可以免費使用此腳本,但請注意,重新發佈代碼需遵守我們的社群規範。
免責聲明
這些資訊和出版物並非旨在提供,也不構成TradingView提供或認可的任何形式的財務、投資、交易或其他類型的建議或推薦。請閱讀使用條款以了解更多資訊。
免責聲明
這些資訊和出版物並非旨在提供,也不構成TradingView提供或認可的任何形式的財務、投資、交易或其他類型的建議或推薦。請閱讀使用條款以了解更多資訊。