OPEN-SOURCE SCRIPT
已更新 Buy Low Sell High Composite Upgraded V6 [kristian6ncqq]

NOTICE: This script is an upgraded and enhanced version of the original "Buy Low Sell High Composite" indicator by [zacmcc] (published in 2017).
The original script provided a composite indicator combining multiple technical analysis metrics such as RSI, MACD, and MFI.
Why I Republished This Script
Intended Use
Enhancements in This Version
Credits
This script is designed to build upon the strengths of the original while adding flexibility and new features to meet the needs of modern traders.
The original script provided a composite indicator combining multiple technical analysis metrics such as RSI, MACD, and MFI.
Why I Republished This Script
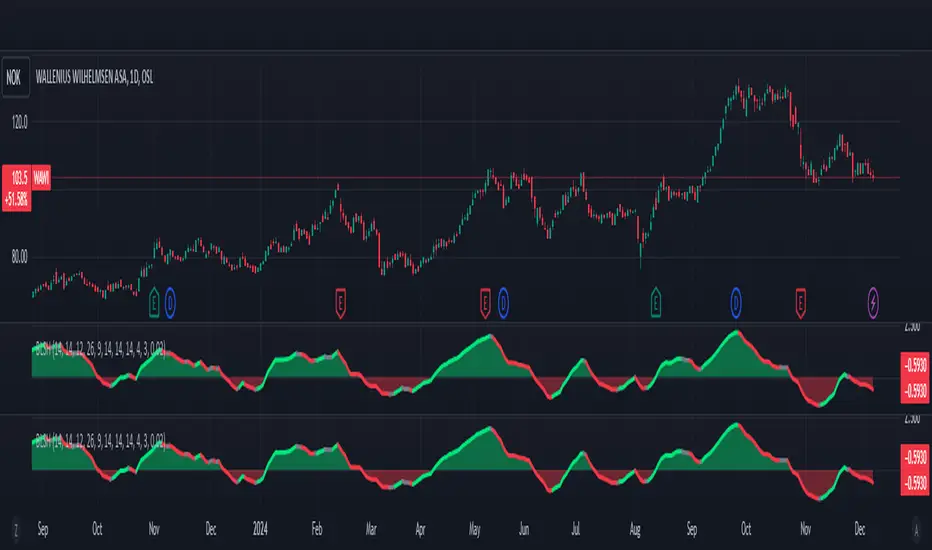
- I found the original indicator to be exceptionally useful for identifying optimal accumulation zones for stocks or assets when prices are low (red area) and potential profit-taking zones when prices are high (green area).
- To ensure it remains accessible and functional for modern trading strategies, I have updated and enhanced the original version with additional features and flexibility.
Intended Use
- This indicator is designed for traders and investors looking to:
- Accumulate stocks or assets when the price is in the low (red) zone.
- Take profits or reduce positions when the price is in the high (green) zone.
- The composite score provides a clear visualization of multiple technical indicators combined into a single actionable signal.
Enhancements in This Version
- Updated to Pine Script v6 (from version 3).
- Added input parameters for key settings (e.g., RSI length, MACD parameters, smoothing).
- Introduced Chande Momentum Oscillator (CMO) and directional ADX for improved trend detection.
- Implemented slope-based trend coloring for outer edges to highlight significant changes in trend direction.
- Enhanced visualizations with customizable thresholds and smoothing for improved usability.
Credits
- Original script: "Buy Low Sell High Composite" by [zacmcc], 2017.
- URL to the original script: Buy Low Sell High Composite.
This script is designed to build upon the strengths of the original while adding flexibility and new features to meet the needs of modern traders.
發行說明
Added Mozilla Public License 2.0發行說明
Summary of Changes:- Ability to Turn Off Indicators:
- You can now easily disable individual indicators like RSI, MACD, MFI, CMO, and ADX via the input settings.
- When an indicator is turned off, it contributes 0 to the calculations, effectively skipping it without disrupting the rest of the indicator.
- Triple EMA Smoothing (TEMA):
- A new smoothing method based on three levels of EMA, which provides faster reactions to price changes.
- By default, this might make the curve slightly less smooth, but increasing the Composite Smoothing Length from, say, 3 to 5 can achieve a similarly smooth curve as before while reacting faster.
- Easier to Experiment with Composite Values:
- With adjustable TEMA and the ability to toggle indicators on/off, it’s now easier to experiment and fine-tune the settings.
- You might discover a combination that works better for your specific stock/crypto or timeframe.
- Unchanged Default Settings:
- If you leave all inputs as they are, the indicator behaves exactly like the previous version, so you can upgrade worry-free.
開源腳本
本著TradingView的真正精神,此腳本的創建者將其開源,以便交易者可以查看和驗證其功能。向作者致敬!雖然您可以免費使用它,但請記住,重新發佈程式碼必須遵守我們的網站規則。
免責聲明
這些資訊和出版物並不意味著也不構成TradingView提供或認可的金融、投資、交易或其他類型的意見或建議。請在使用條款閱讀更多資訊。
開源腳本
本著TradingView的真正精神,此腳本的創建者將其開源,以便交易者可以查看和驗證其功能。向作者致敬!雖然您可以免費使用它,但請記住,重新發佈程式碼必須遵守我們的網站規則。
免責聲明
這些資訊和出版物並不意味著也不構成TradingView提供或認可的金融、投資、交易或其他類型的意見或建議。請在使用條款閱讀更多資訊。