OPEN-SOURCE SCRIPT
RSI Instant Divergence
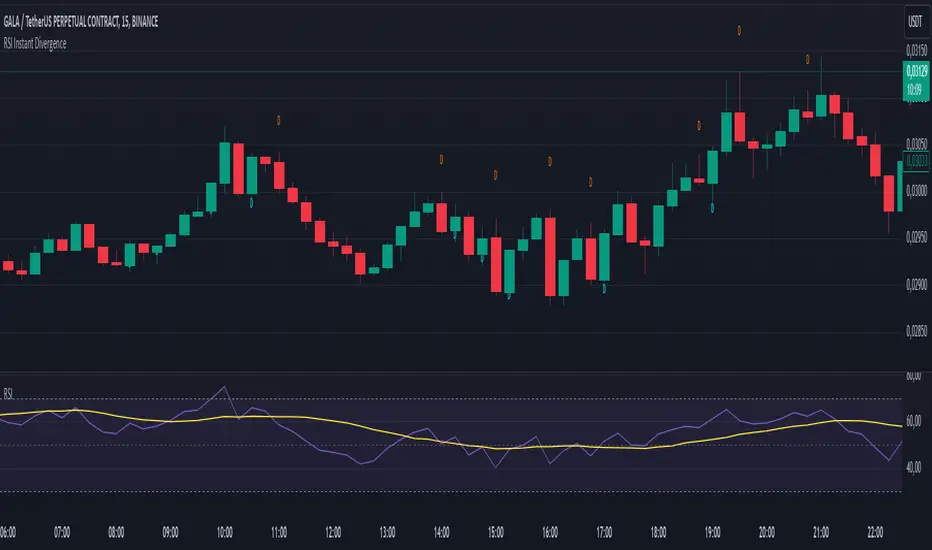
This script detects RSI divergence—a common signal indicating potential trend reversals. It compares price action and RSI behavior to identify two types of divergences:
1- Bearish Divergence (Sell Signal):
Occurs when the price forms a higher high while RSI drops (weaker momentum).
A label appears above the candle, and an alert is triggered: "Divergence: Sell Signal."
2 -Bullish Divergence (Buy Signal):
Occurs when the price makes a lower low while RSI rises (stronger momentum).
A label appears below the candle, and an alert is triggered: "Divergence: Buy Signal."
The labels are color-coded (orange for sell, blue for buy) and include detailed RSI and price info in a tooltip. Alerts help you act immediately when divergence is detected.
This tool is perfect for spotting potential trend reversals and refining your entry/exit strategy. Let me know if you'd like to customize it further! 😊
Tooltip Feature: Each label includes a tooltip with precise RSI and price details (current and previous values) as well as the percentage change in RSI, giving you deeper insight into the divergence. This tool is great for identifying trend reversal points and includes visual labels, tooltips, and alerts to make real-time trading decisions easier. Let me know if you’d like adjustments!
開源腳本
秉持TradingView一貫精神,這個腳本的創作者將其設為開源,以便交易者檢視並驗證其功能。向作者致敬!您可以免費使用此腳本,但請注意,重新發佈代碼需遵守我們的社群規範。
免責聲明
這些資訊和出版物並非旨在提供,也不構成TradingView提供或認可的任何形式的財務、投資、交易或其他類型的建議或推薦。請閱讀使用條款以了解更多資訊。
免責聲明
這些資訊和出版物並非旨在提供,也不構成TradingView提供或認可的任何形式的財務、投資、交易或其他類型的建議或推薦。請閱讀使用條款以了解更多資訊。