OPEN-SOURCE SCRIPT
5-Min EMA Crossover (5/10)
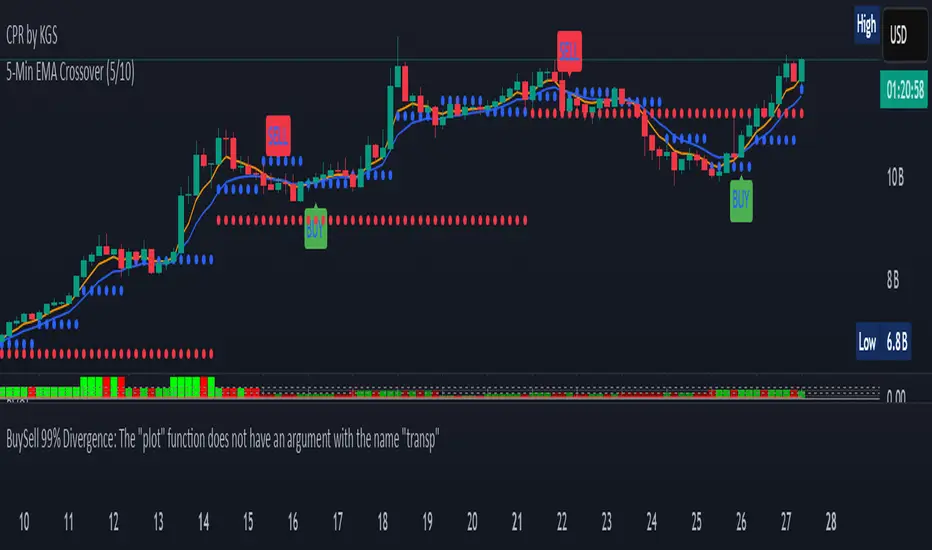
The 5-Minute EMA Crossover (5/10) strategy is a technical trading approach that uses two Exponential Moving Averages (EMAs) on a 5-minute chart to identify potential buy and sell signals based on trend shifts. Here's a description:
EMAs Used:
Fast EMA: 5-period EMA calculated on 5-minute candles. This EMA reacts quickly to recent price changes since it gives more weight to the latest data.
Slow EMA: 10-period EMA calculated on 5-minute candles. It responds more slowly, smoothing out short-term fluctuations.
How the Crossover Works:
A buy signal (long entry) occurs when the 5-period EMA crosses above the 10-period EMA. This suggests that recent price momentum is gaining strength upward, potentially indicating a bullish trend beginning or resuming.
A sell signal (short entry) happens when the 5-period EMA crosses below the 10-period EMA, signaling weakening recent price momentum and a possible bearish trend.
Purpose:
This crossover method helps traders catch short-term trends on a 5-minute timeframe by signaling moments when momentum shifts.
Because EMAs weight recent prices more heavily, the signals tend to be more responsive to fast market moves compared to simple moving averages.
Typical Usage:
Traders apply this to intraday charts (5-minute candles) looking for quick entries and exits.
It is common to use this crossover in combination with other indicators or price action context to reduce false signals.
Example of Signal Application:
When the 5 EMA crosses above the 10 EMA, consider entering a long position.
When the 5 EMA crosses below the 10 EMA, consider exiting longs or entering shorts.
This method leverages short-term momentum shifts visible on the 5-minute timeframe to help take advantage of intraday trends or reversals.
開源腳本
秉持TradingView一貫精神,這個腳本的創作者將其設為開源,以便交易者檢視並驗證其功能。向作者致敬!您可以免費使用此腳本,但請注意,重新發佈代碼需遵守我們的社群規範。
免責聲明
這些資訊和出版物並非旨在提供,也不構成TradingView提供或認可的任何形式的財務、投資、交易或其他類型的建議或推薦。請閱讀使用條款以了解更多資訊。
免責聲明
這些資訊和出版物並非旨在提供,也不構成TradingView提供或認可的任何形式的財務、投資、交易或其他類型的建議或推薦。請閱讀使用條款以了解更多資訊。