PROTECTED SOURCE SCRIPT
已更新 DCVIX
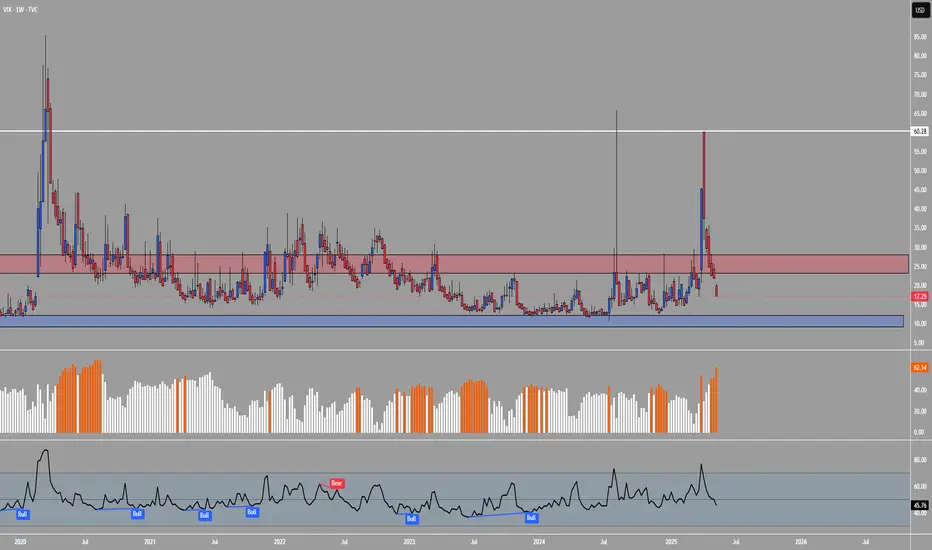
The DCVIX is a modified version of the Williams Vix Fix indicator.
It is a volatility based indicator based on Bollinger Bands and Standard Deviations. It is designed to assist you in identifying times of high and low volatility.
During times of high volatility (squeeze), price action often finds a local bottom. During times of low volatility, price action often finds a local top.
The DCVIX will print aqua bars on the histogram during times of high volatility (squeeze). This will assist you in identifying potential price action bottom.
The DCVIX also shows the changes in volatility based on the size of the bars. This may also assist you in identifying breakouts and even potential market tops.
This indicator is designed to be used in conjunction with other forms of confluence.
發行說明
Updated to V6受保護腳本
此腳本以閉源形式發佈。 不過,您可以自由使用,沒有任何限制 — 點擊此處了解更多。
免責聲明
這些資訊和出版物並非旨在提供,也不構成TradingView提供或認可的任何形式的財務、投資、交易或其他類型的建議或推薦。請閱讀使用條款以了解更多資訊。
受保護腳本
此腳本以閉源形式發佈。 不過,您可以自由使用,沒有任何限制 — 點擊此處了解更多。
免責聲明
這些資訊和出版物並非旨在提供,也不構成TradingView提供或認可的任何形式的財務、投資、交易或其他類型的建議或推薦。請閱讀使用條款以了解更多資訊。