OPEN-SOURCE SCRIPT
已更新 NSDT HAMA Candles
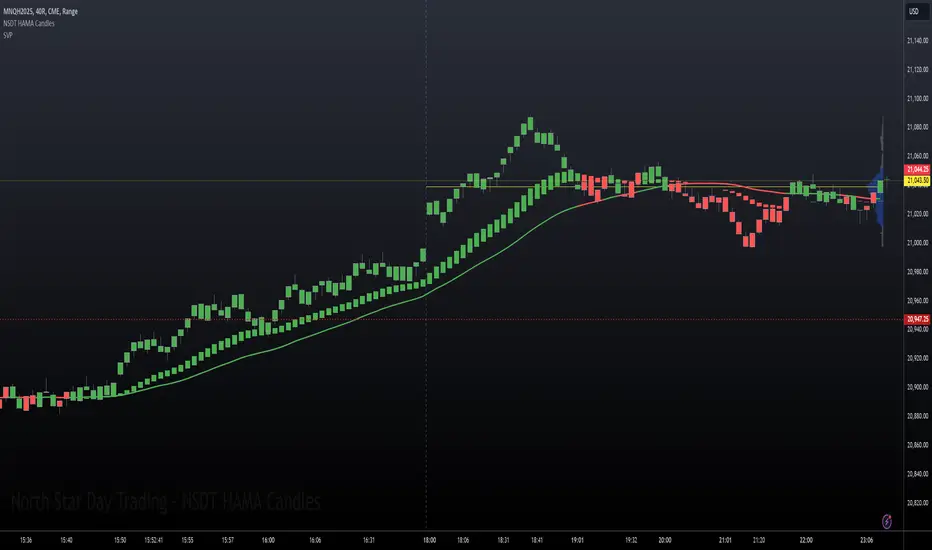
HAMA (Heiken-Ashi Moving Average) Candles are built using different moving average lengths for the open, high, low, and close. Those levels are then run through the Heiken-Ashi Candle formula to create a new hybrid candle on the chart. There is an additional Moving Average plotted as well for overall direction.
This may be used best for identifying trending markets. By referencing the HAMA Candle indicator, it may help guide you to stay in a trade a bit longer, or wait a bit longer before entering at the beginning of a potential trend.
We added a Gradient Color scheme option for a more colorful view of potential trend directional changes. The gradient code is taken from the Pinecoders Gradient Framework (Pro Advance/Decline Gradient example) at![Color Gradient Framework [PineCoders]](https://s3.tradingview.com/h/hqH4YIFa_mid.png)
There are three different Moving Average types to choose from. (EMA, SMA, WMA). All MA lengths can be modified. All colors can be modified. All options can be turned on or off.
This was previously an "invite-only" indicator, but we decided to publish it publicly and open source.
This may be used best for identifying trending markets. By referencing the HAMA Candle indicator, it may help guide you to stay in a trade a bit longer, or wait a bit longer before entering at the beginning of a potential trend.
We added a Gradient Color scheme option for a more colorful view of potential trend directional changes. The gradient code is taken from the Pinecoders Gradient Framework (Pro Advance/Decline Gradient example) at
There are three different Moving Average types to choose from. (EMA, SMA, WMA). All MA lengths can be modified. All colors can be modified. All options can be turned on or off.
This was previously an "invite-only" indicator, but we decided to publish it publicly and open source.
發行說明
Updated to current code version.Code logic was not changed.
Removed the "high" and "low" inputs as they were not needed.
The main MA line was modified from "close" to "hl2" for better average of candle price action.
發行說明
Updated Pinescript code.Added published version tracking.
No changes to functionality were made.
Code is free and open source.
開源腳本
本著TradingView的真正精神,此腳本的創建者將其開源,以便交易者可以查看和驗證其功能。向作者致敬!雖然您可以免費使用它,但請記住,重新發佈程式碼必須遵守我們的網站規則。
ALL indicators, strategies and bots are included with Discord access.
NorthStarDayTrading.com/discord
youtube.com/shorts/fWFQE7uEHvU
NorthStarDayTrading.com/discord
youtube.com/shorts/fWFQE7uEHvU
免責聲明
這些資訊和出版物並不意味著也不構成TradingView提供或認可的金融、投資、交易或其他類型的意見或建議。請在使用條款閱讀更多資訊。