OPEN-SOURCE SCRIPT
已更新 7 Week Rule

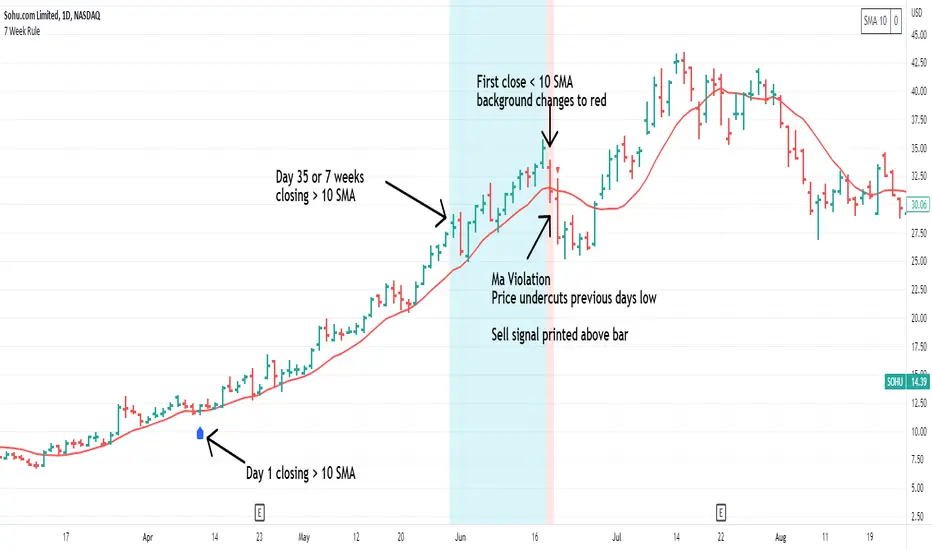
The 7 week rule was shared by Gil Morales in his book “Trade Like an O’Neil Disciple”. The rule is described as: Stocks that have shown a tendency to “obey” or “respect” the 10-day moving average for at least 7 weeks in an uptrend should often be sold once the stock violates the 10-day line. A “violation” is defined as a close below the 10-day moving average followed by a move on the next day below the intraday low of the first day.
This indicator makes using the 7 week rule easy. Once a stock has closed above its selected moving average (10SMA by default) for 35 days the 7 week rule is triggered. Once the stock then “violates” the moving average, a sell signal is printed on the chart.
Indicator Customizations
Indicator is dynamic and will continue the count if no violation occurs.

This indicator makes using the 7 week rule easy. Once a stock has closed above its selected moving average (10SMA by default) for 35 days the 7 week rule is triggered. Once the stock then “violates” the moving average, a sell signal is printed on the chart.
Indicator Customizations
- Moving Average Length & Type
- Show or Hide Moving Average
- Show Running Count of Days Above Selected MA
- Highlight When 7 Week Rule Triggers
- Option to Show First Day Above MA
Indicator is dynamic and will continue the count if no violation occurs.
發行說明
Small change to day 1 label placement開源腳本
秉持TradingView一貫精神,這個腳本的創作者將其設為開源,以便交易者檢視並驗證其功能。向作者致敬!您可以免費使用此腳本,但請注意,重新發佈代碼需遵守我們的社群規範。
Trusted Pine programmer. Send me a message for script development.
免責聲明
這些資訊和出版物並非旨在提供,也不構成TradingView提供或認可的任何形式的財務、投資、交易或其他類型的建議或推薦。請閱讀使用條款以了解更多資訊。
開源腳本
秉持TradingView一貫精神,這個腳本的創作者將其設為開源,以便交易者檢視並驗證其功能。向作者致敬!您可以免費使用此腳本,但請注意,重新發佈代碼需遵守我們的社群規範。
Trusted Pine programmer. Send me a message for script development.
免責聲明
這些資訊和出版物並非旨在提供,也不構成TradingView提供或認可的任何形式的財務、投資、交易或其他類型的建議或推薦。請閱讀使用條款以了解更多資訊。