INVITE-ONLY SCRIPT
Excess Invites Punishment (EIP) by Scipio Pro
Scipio Pro's EIP is a reversal indicator. It is based on two types of evidence.
1) Proof of Fatigue -- The move that triggers the signal is losing momentum
2) Proof of Excess -- The move that triggers the signal is excessive
If both are the case, we get a signal.
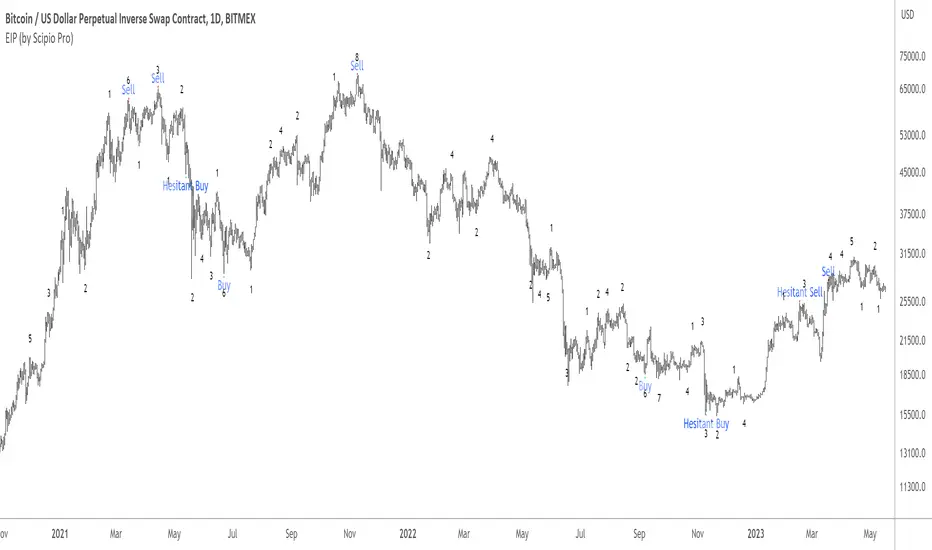
The script uses standard deviations and Bollinger Bands for measuring excess and the ATR for the Breakout Continuation Protection (see below). For fatigue, the EIP detects divergences from indicators like OBV, MACD, RSI and more. It expresses these with a number. For example, if the EIP detects 9 bullish divergences, it prints the number 9 below the corresponding candle.
Hesitant Buy and Hesitant Sell mean there may have been a breakout recently, as measured with the ATR, meaning there is an increased likelihood of continuation. These can provide good buys or sells but more caution is warranted. You can adjust the so-called Breakout Continuation Protection in Settings. Doing so may lead to either more or less "hesitant" signals.
The signals don't repaint. Of course, the divergences get recalculated as the market evolves, as they should. But signals like Buy, Sell, Hesitant Buy, and Hesitant Sell never repaint.
The EIP is useful on many different time-frames and with many different assets, be they in stocks or crypto. The images below show results from BTC, MATIC, and S&P 500 over multiple years, both on small and large time-frames.
As always, use at your own risk. Using indicators is no substitute for using one's brain.


1) Proof of Fatigue -- The move that triggers the signal is losing momentum
2) Proof of Excess -- The move that triggers the signal is excessive
If both are the case, we get a signal.
The script uses standard deviations and Bollinger Bands for measuring excess and the ATR for the Breakout Continuation Protection (see below). For fatigue, the EIP detects divergences from indicators like OBV, MACD, RSI and more. It expresses these with a number. For example, if the EIP detects 9 bullish divergences, it prints the number 9 below the corresponding candle.
Hesitant Buy and Hesitant Sell mean there may have been a breakout recently, as measured with the ATR, meaning there is an increased likelihood of continuation. These can provide good buys or sells but more caution is warranted. You can adjust the so-called Breakout Continuation Protection in Settings. Doing so may lead to either more or less "hesitant" signals.
The signals don't repaint. Of course, the divergences get recalculated as the market evolves, as they should. But signals like Buy, Sell, Hesitant Buy, and Hesitant Sell never repaint.
The EIP is useful on many different time-frames and with many different assets, be they in stocks or crypto. The images below show results from BTC, MATIC, and S&P 500 over multiple years, both on small and large time-frames.
As always, use at your own risk. Using indicators is no substitute for using one's brain.
僅限邀請腳本
僅作者批准的使用者才能訪問此腳本。您需要申請並獲得使用許可,通常需在付款後才能取得。更多詳情,請依照作者以下的指示操作,或直接聯絡ScipioPro。
TradingView不建議在未完全信任作者並了解其運作方式的情況下購買或使用腳本。您也可以在我們的社群腳本中找到免費的開源替代方案。
作者的說明
Get access to this indicator through our website: https://scipio.pro (and not through the comment section).
Get access to our indicators now at scipio.pro
免責聲明
這些資訊和出版物並非旨在提供,也不構成TradingView提供或認可的任何形式的財務、投資、交易或其他類型的建議或推薦。請閱讀使用條款以了解更多資訊。