OPEN-SOURCE SCRIPT
Put-Call Bias Indicator
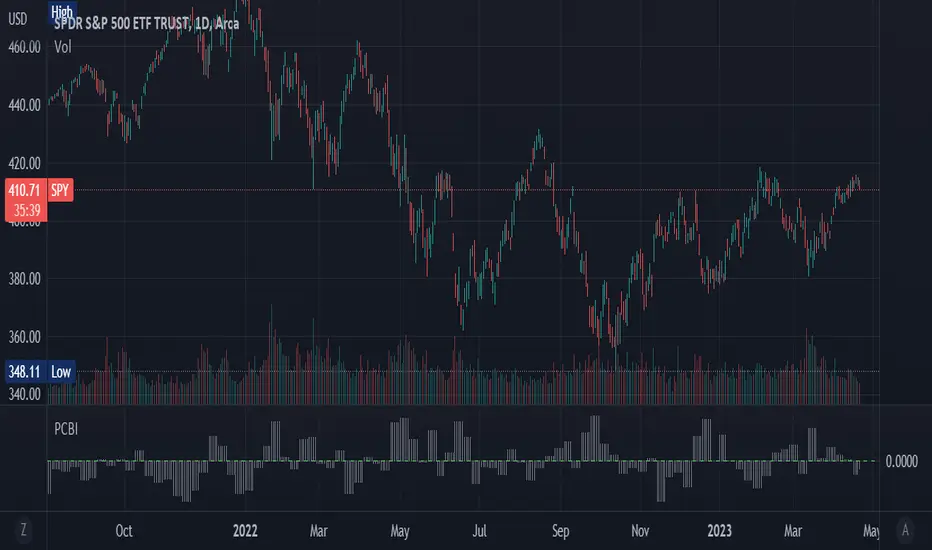
The Put-Call Bias Indicator provides a visual representation of the relative bias towards put options using CBOE data. This script calculates the Put/All ratio, displaying the difference as compared to an even 50% ratio as columns on the chart. A positive value indicates a higher proportion of puts being bought compared to the total number of options contracts.
The indicator uses weekly CBOE data to determine the Put/Call ratio, making it suitable for analyzing longer-term trends in options trading sentiment. The gray columns represent the bias towards puts, with the green horizontal line at 0 acting as a reference point to quickly identify the prevailing bias.
In addition to providing an overview of market sentiment, this indicator can also be used as a contrarian indicator. A high Put/All ratio may suggest that the market is overly bearish, potentially signaling a bullish reversal, while a low ratio may indicate an overly bullish market, potentially pointing to a bearish reversal. Please note that this indicator should be used in conjunction with other technical analysis tools and indicators for a comprehensive understanding of the market.
(This is a new version of an old script bc previous version was deleted by TradingView; republishing with a more verbose description)
開源腳本
本著TradingView的真正精神,此腳本的創建者將其開源,以便交易者可以查看和驗證其功能。向作者致敬!雖然您可以免費使用它,但請記住,重新發佈程式碼必須遵守我們的網站規則。
免責聲明
這些資訊和出版物並不意味著也不構成TradingView提供或認可的金融、投資、交易或其他類型的意見或建議。請在使用條款閱讀更多資訊。
免責聲明
這些資訊和出版物並不意味著也不構成TradingView提供或認可的金融、投資、交易或其他類型的意見或建議。請在使用條款閱讀更多資訊。