OPEN-SOURCE SCRIPT
Stock Highs Tracker
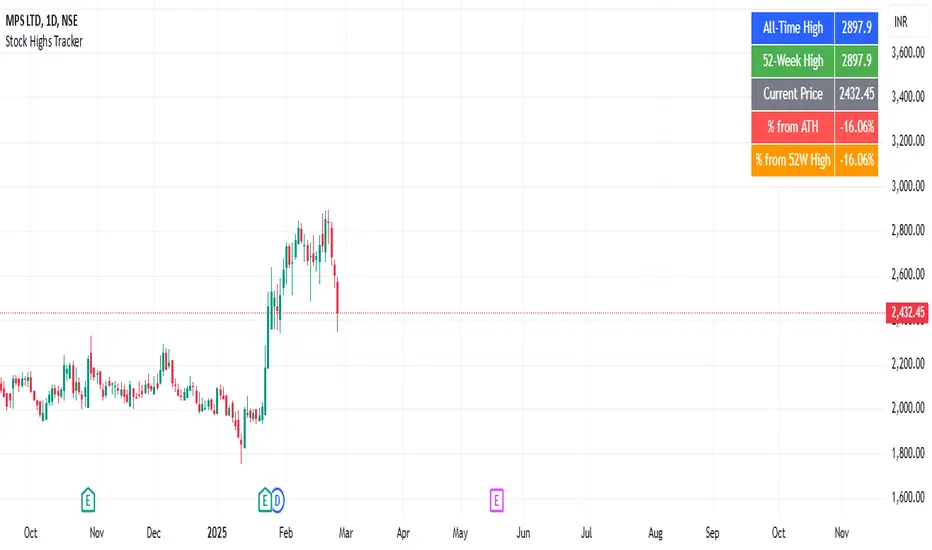
This indicator tracks key stock price levels including the all-time high (ATH), 52-week high, and current price.
It calculates the percentage difference of the current price from both the ATH and 52-week high.
The data is displayed in a table at the top-right corner of the chart, allowing traders to quickly assess the stock’s performance relative to its historical highs.
This is useful for identifying stocks trading near their highs or experiencing significant pullbacks.
開源腳本
本著TradingView的真正精神,此腳本的創建者將其開源,以便交易者可以查看和驗證其功能。向作者致敬!雖然您可以免費使用它,但請記住,重新發佈程式碼必須遵守我們的網站規則。
免責聲明
這些資訊和出版物並不意味著也不構成TradingView提供或認可的金融、投資、交易或其他類型的意見或建議。請在使用條款閱讀更多資訊。
開源腳本
本著TradingView的真正精神,此腳本的創建者將其開源,以便交易者可以查看和驗證其功能。向作者致敬!雖然您可以免費使用它,但請記住,重新發佈程式碼必須遵守我們的網站規則。
免責聲明
這些資訊和出版物並不意味著也不構成TradingView提供或認可的金融、投資、交易或其他類型的意見或建議。請在使用條款閱讀更多資訊。