OPEN-SOURCE SCRIPT
已更新 Half Supertrend [NLR]
While the Supertrend is a popular tool, traders often face the challenge of false signals and uncertain entry points. The Half Supertrend [NLR] indicator addresses these shortcomings by introducing a dynamic mid-level, offering a significantly improved way to identify true trend strength and potential high-probability entries.
Here's how the mid-level enhances your trend analysis:
Here's the technical edge you've been waiting for:
How it works under the hood:
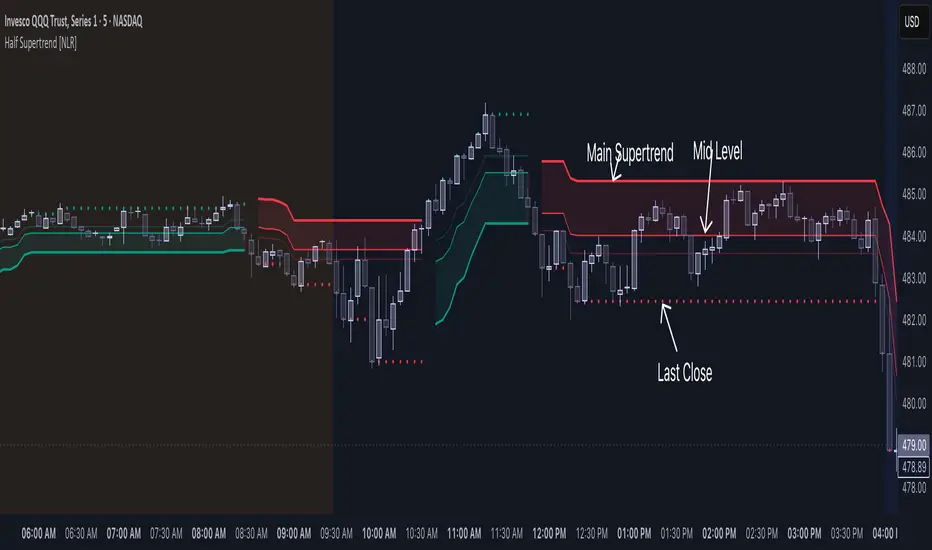
This indicator utilizes the standard Supertrend calculation on the chosen higher timeframe, incorporating the Average True Range (ATR) to determine volatility-adjusted bands. The unique addition is the "half trend" line, calculated by adding or subtracting half of the ATR-based trailing stop value from the Supertrend line. This mid-level acts as a crucial intermediary zone for evaluating the conviction of the current trend.
Pine Script®
Key Input Parameters:
Here's how the mid-level enhances your trend analysis:
- Filter Out Noise: Instead of reacting to every Supertrend flip, the mid-level helps you identify the strength of the trend. Price moving strongly away from the mid-level confirms a higher conviction move.
- Identify Optimal Pullback Entries: Waiting for price to pull back to the dynamic mid-level after a Supertrend direction change can provide better entry prices and potentially higher probability setups, capitalizing on established momentum. This approach helps avoid entering prematurely on weaker signals.
- Gain Deeper Trend Insight: The position of the price relative to both the Supertrend line and the mid-level paints a clearer picture of the current trend's strength and potential for continuation or reversal.
Here's the technical edge you've been waiting for:
- Enhanced Trend Confirmation: This indicator plots a mid-level derived from half the Average True Range (ATR) multiple, acting as a crucial intermediary for assessing trend strength.
- Intra-Trend Strength Analysis:
Price above/below the mid-level: Indicates a strong trending move aligned with the Supertrend direction.
Price between the mid-level and the Supertrend line: Suggests a weaker trend and a higher probability of consolidation or reversal. - Early Reversal Detection: Price crossing the mid-level can serve as an early warning signal of a potential trend change.
- Higher Timeframe Clarity: The user-configurable higher timeframe (HTF) input provides a robust, multi-timeframe trend bias.
- Dynamic Entry Levels: Potential entry levels based on the mid-level are plotted for visual guidance.
- Clear Visual Representation: Color-coded lines and filled areas simplify trend and strength assessment.
How it works under the hood:
This indicator utilizes the standard Supertrend calculation on the chosen higher timeframe, incorporating the Average True Range (ATR) to determine volatility-adjusted bands. The unique addition is the "half trend" line, calculated by adding or subtracting half of the ATR-based trailing stop value from the Supertrend line. This mid-level acts as a crucial intermediary zone for evaluating the conviction of the current trend.
// Calculate the mid-level line
half_line = supertrend + (atr * half_factor)
Key Input Parameters:
- ATR Length: Determines the period for calculating the Average True Range (default: 10).
- Factor: The multiplier applied to the ATR to determine the Supertrend band width (default: 3). The mid-level dynamically adjusts based on half of this factor.
- Timeframe: Allows you to select a higher timeframe for the Supertrend calculation, providing a broader trend context.
- Up Color/Down Color: Customize the colors for uptrend and downtrend indications.
發行說明
Removed default extra timeframe feature開源腳本
秉持TradingView一貫精神,這個腳本的創作者將其設為開源,以便交易者檢視並驗證其功能。向作者致敬!您可以免費使用此腳本,但請注意,重新發佈代碼需遵守我們的社群規範。
免責聲明
這些資訊和出版物並非旨在提供,也不構成TradingView提供或認可的任何形式的財務、投資、交易或其他類型的建議或推薦。請閱讀使用條款以了解更多資訊。
開源腳本
秉持TradingView一貫精神,這個腳本的創作者將其設為開源,以便交易者檢視並驗證其功能。向作者致敬!您可以免費使用此腳本,但請注意,重新發佈代碼需遵守我們的社群規範。
免責聲明
這些資訊和出版物並非旨在提供,也不構成TradingView提供或認可的任何形式的財務、投資、交易或其他類型的建議或推薦。請閱讀使用條款以了解更多資訊。