OPEN-SOURCE SCRIPT
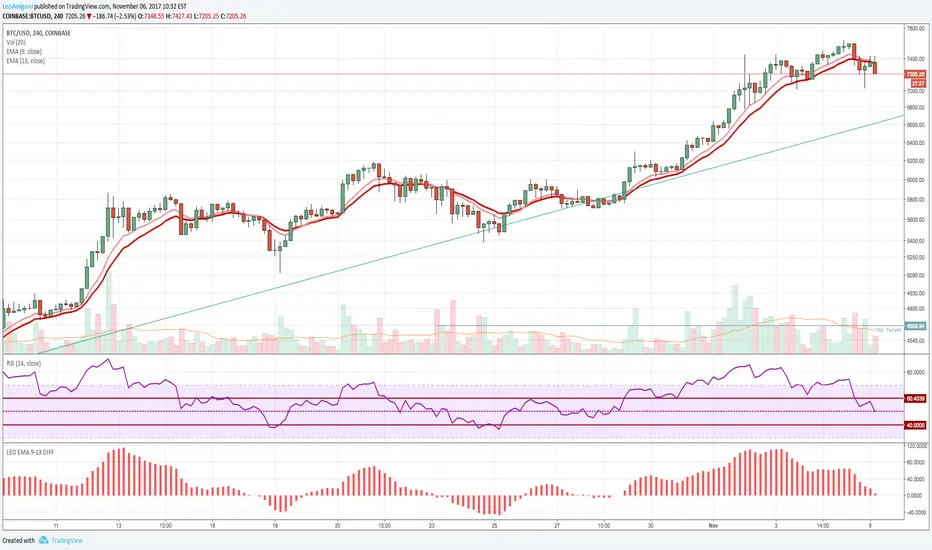
LEO EMA 9-13 DIFF
I made a public version of the private one that I made since I had so many requests.
Good indicator for buy and sell signals, better for buys usually works well on any timeframes. I use it on the 15m, 1hr, 4hr mostly.
You can plot the EMA's also on the chart to see the lines crossing but this indicator gives you a much easier read. It's very simple and basic all I do is plot the difference between the EMA 9 and the EMA 13. These values seem to give a very clear signal for entries and exits.
How to use.
- When the histogram becomes positive it's a buy signal when it becomes negative it's a sell signal.
- Note: Like any moving average this doesn't work well if you have a massive dip or a massive spike as the average will signal too late. but you should get some warning right before it happens.
開源腳本
本著TradingView的真正精神,此腳本的創建者將其開源,以便交易者可以查看和驗證其功能。向作者致敬!雖然您可以免費使用它,但請記住,重新發佈程式碼必須遵守我們的網站規則。
免責聲明
這些資訊和出版物並不意味著也不構成TradingView提供或認可的金融、投資、交易或其他類型的意見或建議。請在使用條款閱讀更多資訊。
開源腳本
本著TradingView的真正精神,此腳本的創建者將其開源,以便交易者可以查看和驗證其功能。向作者致敬!雖然您可以免費使用它,但請記住,重新發佈程式碼必須遵守我們的網站規則。
免責聲明
這些資訊和出版物並不意味著也不構成TradingView提供或認可的金融、投資、交易或其他類型的意見或建議。請在使用條款閱讀更多資訊。