INVITE-ONLY SCRIPT
Expansion Contraction Indicator
NOTE: This indicator is free. Request access at https://ticksurfers.com/xc
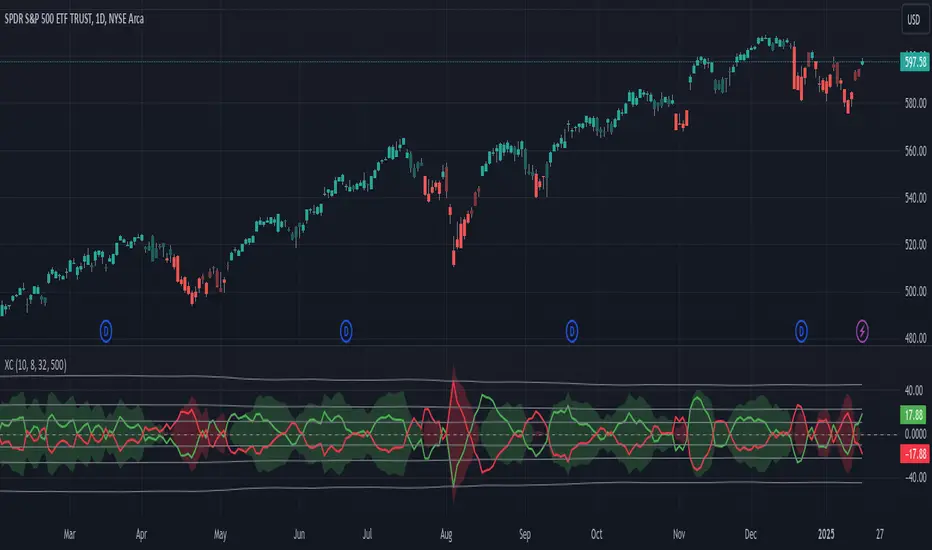
Expansion Contraction measures the speed at which price moves through two moving averages, a 10 period SMA of the high and an 8 period SMA of the low (Moving Average Channel). When the Positive (green) line crosses above the zero line and the cloud is green, we are in a strong uptrend and a buy signal can be taken. When the Negative (red) line crosses above the zero line and the cloud is red, we are in a strong downtrend and a sell signal can be taken.
Standard deviation (gray) lines are added to measure the strength of the trend and support and resistance areas. When the short lines go above 1 or 2 standard deviations, it may indicate price may have gotten very high or very low too quickly in the short term. When the cloud goes above 2 standard deviations, it may indicate the overall trend may be getting ready for a reversal.
Formula created by Brian Latta, author of The Book on Trading - The Secret Language of the Markets. Moving Average Channel concept by Jake Bernstein, author of many best-seller books on day-trading, including The Compleat Day Trader, Seasonal Futures Spreads, and more.
僅限邀請腳本
僅作者批准的使用者才能訪問此腳本。您需要申請並獲得使用許可,通常需在付款後才能取得。更多詳情,請依照作者以下的指示操作,或直接聯絡TickSurfers。
請注意,此私人、僅限受邀使用者使用的腳本未經腳本審核員審核,其是否符合社群規範尚待確定。 TradingView不建議在未完全信任作者並了解其運作方式的情況下購買或使用腳本。您也可以在我們的社群腳本中找到免費的開源替代方案。
作者的說明
This indicator is free. Request access at https://ticksurfers.com/xc
免責聲明
這些資訊和出版物並非旨在提供,也不構成TradingView提供或認可的任何形式的財務、投資、交易或其他類型的建議或推薦。請閱讀使用條款以了解更多資訊。