OPEN-SOURCE SCRIPT
Multi-Timeframe Bias by Atif Muzzammil
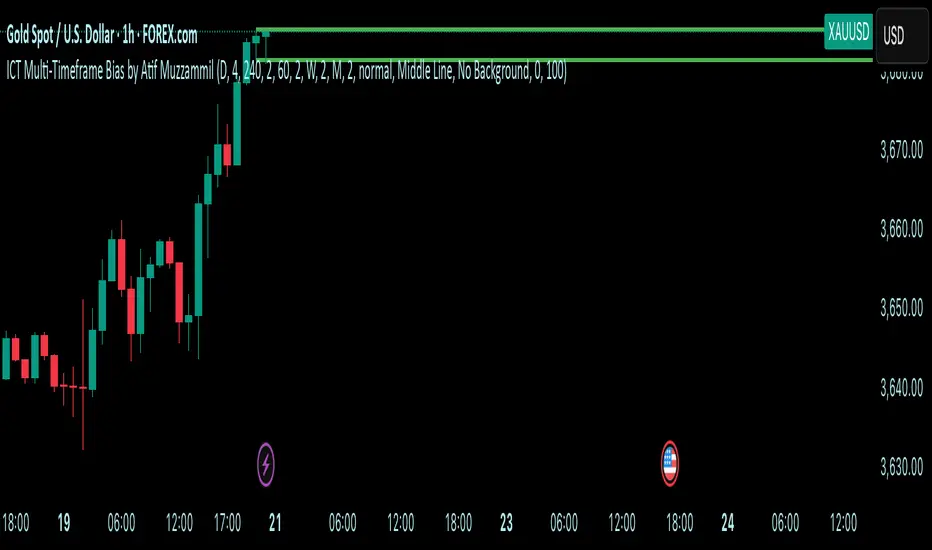
Multi-Timeframe Bias Indicator
This indicator implements multi TF bias concepts across multiple timeframes simultaneously. It identifies and displays bias levels.
Key Features:
Multi-Timeframe Analysis (Up to 5 Timeframes)
Supports all major timeframes: 5m, 15m, 30m, 1H, 4H, Daily, Weekly, Monthly
Each timeframe displays independently with customisable colors and line weights
Clean visual separation between different timeframe bias levels
ICT Bias Logic
Bearish Bias: Previous period close below the prior period's low
Bullish Bias: Previous period close above the prior period's high
Ranging Bias: Previous period close within the prior period's range
Draws horizontal lines at previous period's high and low levels
Advanced Customisation
Individual enable/disable for each timeframe
Custom colors and line thickness per timeframe
Comprehensive label settings with 4 position options
Adjustable label size, style (background/no background/text only)
Horizontal label positioning (0-100%) for optimal placement
Vertical offset controls for fine-tuning
Smart Detection
Automatic timeframe change detection using multiple methods
Enhanced detection for 4H, Weekly, and Monthly periods
Works correctly when viewing same timeframe as bias timeframe
Proper handling of market session boundaries
Clean Interface
Simple timeframe identification labels
Non-intrusive design that doesn't obstruct price action
Organized settings grouped by function
Debug mode available for troubleshooting
Compatible with all chart timeframes and works on any market that follows standard session timing.
開源腳本
秉持TradingView一貫精神,這個腳本的創作者將其設為開源,以便交易者檢視並驗證其功能。向作者致敬!您可以免費使用此腳本,但請注意,重新發佈代碼需遵守我們的社群規範。
免責聲明
這些資訊和出版物並非旨在提供,也不構成TradingView提供或認可的任何形式的財務、投資、交易或其他類型的建議或推薦。請閱讀使用條款以了解更多資訊。
免責聲明
這些資訊和出版物並非旨在提供,也不構成TradingView提供或認可的任何形式的財務、投資、交易或其他類型的建議或推薦。請閱讀使用條款以了解更多資訊。