OPEN-SOURCE SCRIPT
已更新 Revolver Oscillator Strategy 1.2 (RSI+UO+MFI)

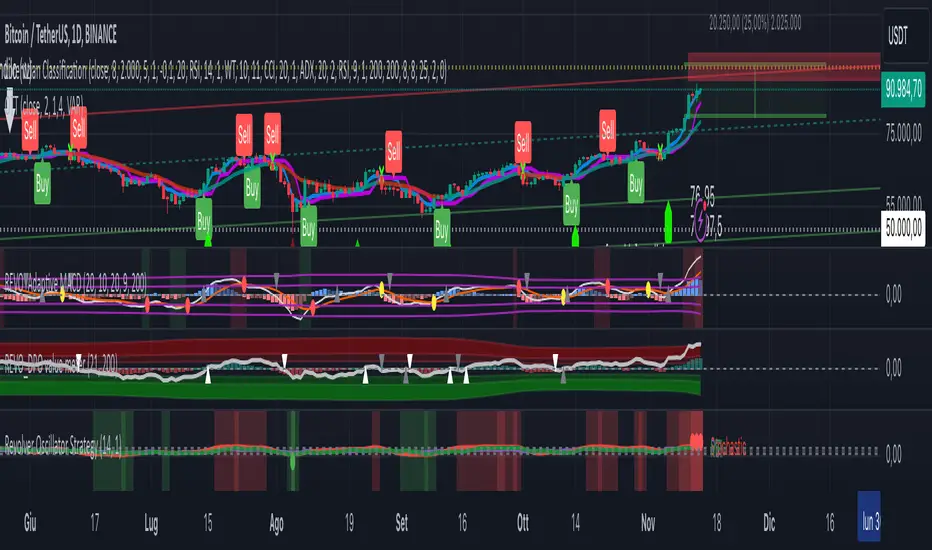
ROS (Revolver Oscillator Strategy)
Version 1.2
Description
This script combines three popular oscillators (RSI, Ultimate Oscillator and MFI) to accurately determine the price momentum of an asset.
Context
- RSI (Relative Strength Index) is a momentum oscillator that measures the speed and change of price movements over a period of time (14).
- Ultimate Oscillator uses three different periods (7, 14, and 28) to represent short, medium, and long-term market trends.
- Money Flow Index (MFI) is a momentum indicator that measures the flow of money into and out over a period of time. It is related to the Relative Strength Index (RSI) but incorporates volume, whereas the RSI only considers price
How does it work?
When a RED bar appears, it means that the three oscillators have exceeded the set thresholds, and it is a SELL signal.
When a GREEN bar appears, it means that the three oscillators are below the set thresholds, and it is a BUY signal.
I recommend leaving the default settings.
發行說明
Fixed some bugs發行說明
New color codesRSI: purple line
Ultimate Oscillator: red line
Money Flow Index: green line
發行說明
Added a swith to deactivate MFI in the strategy calculation.發行說明
Added a swith to deactivate ULT in the strategy calculation.發行說明
Improvements in the UI.發行說明
Improvements in the UI.發行說明
Various improvements in the interface發行說明
Updated oscillator algoritm發行說明
General UpdateAdded QQE oscillator
發行說明
Added green/red dots to indicate extreme areasAdded median wave (thanks to Fab_Coin_ )
開源腳本
秉持TradingView一貫精神,這個腳本的創作者將其設為開源,以便交易者檢視並驗證其功能。向作者致敬!您可以免費使用此腳本,但請注意,重新發佈代碼需遵守我們的社群規範。
免責聲明
這些資訊和出版物並非旨在提供,也不構成TradingView提供或認可的任何形式的財務、投資、交易或其他類型的建議或推薦。請閱讀使用條款以了解更多資訊。
開源腳本
秉持TradingView一貫精神,這個腳本的創作者將其設為開源,以便交易者檢視並驗證其功能。向作者致敬!您可以免費使用此腳本,但請注意,重新發佈代碼需遵守我們的社群規範。
免責聲明
這些資訊和出版物並非旨在提供,也不構成TradingView提供或認可的任何形式的財務、投資、交易或其他類型的建議或推薦。請閱讀使用條款以了解更多資訊。