Back to my favourite topic - Zigzags.
Here is an indicator which can help you visualise volume data on Zigzag swing highs and lows.
Settings are pretty simple and provides variety of display options
https://www.tradingview.com/x/hdcboFQx/
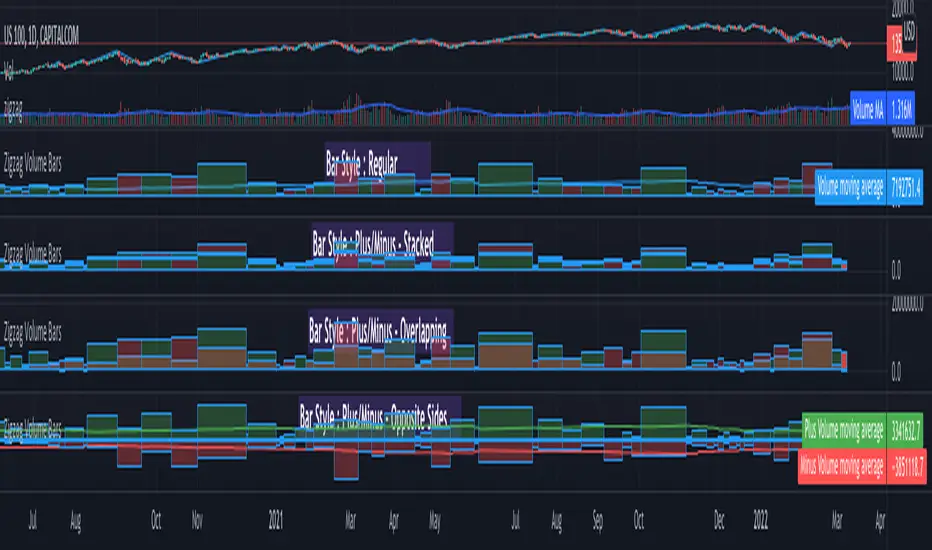
Display options are as demonstrated in the chart has following main types.
https://www.tradingview.com/x/WmXT7Kgp/
Apart from the main display types, stacked display has several sub-types which determine whether to place green bar below red or the other way around.
Snapshot below shows example of each type.
https://www.tradingview.com/x/CeiQ8FEE/
Here is an indicator which can help you visualise volume data on Zigzag swing highs and lows.
Settings are pretty simple and provides variety of display options
https://www.tradingview.com/x/hdcboFQx/
Display options are as demonstrated in the chart has following main types.
- Regular
- Plus/Minus - Stacked
- Plus/Minus - Overlapping
- Plus/Minus - Opposite Sides
https://www.tradingview.com/x/WmXT7Kgp/
Apart from the main display types, stacked display has several sub-types which determine whether to place green bar below red or the other way around.
Snapshot below shows example of each type.
https://www.tradingview.com/x/CeiQ8FEE/
開源腳本
秉持TradingView一貫精神,這個腳本的創作者將其設為開源,以便交易者檢視並驗證其功能。向作者致敬!您可以免費使用此腳本,但請注意,重新發佈代碼需遵守我們的社群規範。
Trial - trendoscope.io/trial
Subscribe - trendoscope.io/pricing
Blog - docs.trendoscope.io
Subscribe - trendoscope.io/pricing
Blog - docs.trendoscope.io
免責聲明
這些資訊和出版物並非旨在提供,也不構成TradingView提供或認可的任何形式的財務、投資、交易或其他類型的建議或推薦。請閱讀使用條款以了解更多資訊。