OPEN-SOURCE SCRIPT
Rivanews Setup - Riva-Keltner, Média Rock [xdecow]
This setup was created by Rivadavila S. Malheiros
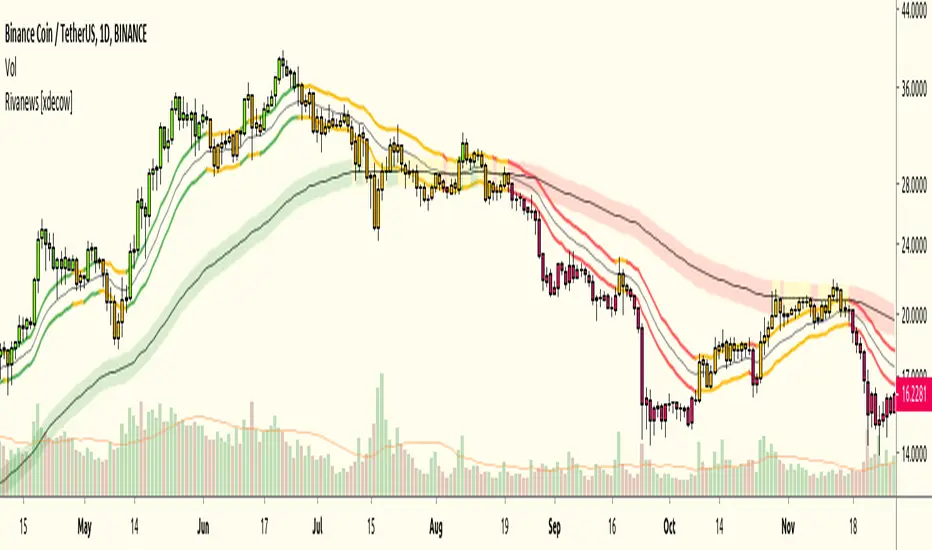
There are 2 Keltner Channels with exponential moving averages of 21 (riva) and 89 (rock) and ATR multiplier of 0.618.
When the price is between the bands, it is a sign of consolidation (yellow).
When the price is above the bands, it is an upward trend (green).
When the price is below the bands, it is a downward trend (red).
When the price crosses rock 89 and closes up / down, it may be a sign of a reversal. But it has a high probability of testing rock 89 again.
------------------------------------------------------------------------------------------
PT-BR
Este setup foi criado por Rivadavila S. Malheiros
São 2 Keltner Channels com médias móveis exponenciais de 21 (riva) e 89 (rock) e multiplicador do ATR de 0.618.
Quando o preço está entre as bandas, é sinal de consolidação (amarelo).
Quando o preço está acima das bandas, é uma tendencia de alta (verde).
Quando o preço está abaixo das bandas, é uma tendencia de baixa (vermelho).
Quando o preço cruza a rock 89 e fecha acima/abaixo, pode ser sinal de reversão. Mas tem uma alta probabilidade de testar a rock 89 novamente.
開源腳本
本著TradingView的真正精神,此腳本的創建者將其開源,以便交易者可以查看和驗證其功能。向作者致敬!雖然您可以免費使用它,但請記住,重新發佈程式碼必須遵守我們的網站規則。
免責聲明
這些資訊和出版物並不意味著也不構成TradingView提供或認可的金融、投資、交易或其他類型的意見或建議。請在使用條款閱讀更多資訊。
免責聲明
這些資訊和出版物並不意味著也不構成TradingView提供或認可的金融、投資、交易或其他類型的意見或建議。請在使用條款閱讀更多資訊。