INVITE-ONLY SCRIPT
Banker Chip Pro (MI04)
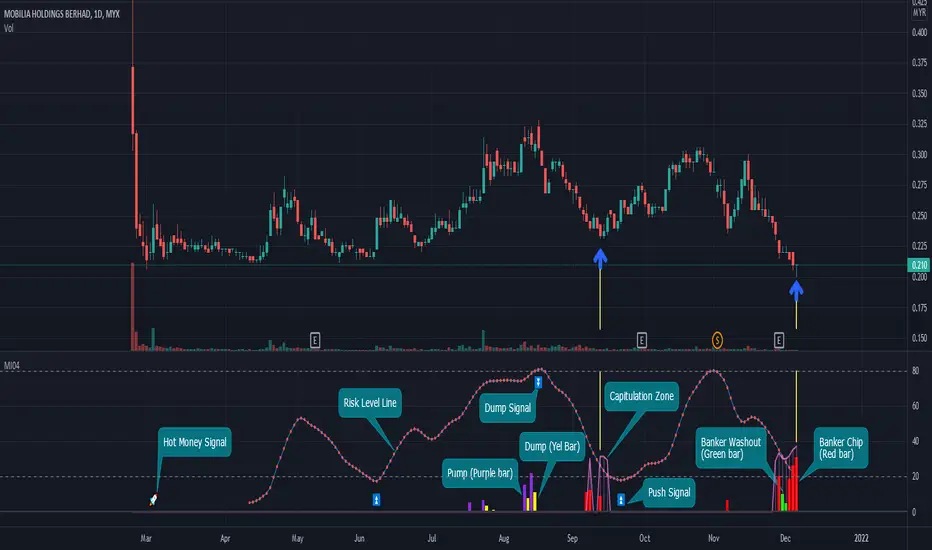
The Banker Chip Pro (MI04) indicator is used to track the activity of the banker collecting shares in the stage when price unexpectedly drops drastically,
and also pump & dump action with strong pull-up in stock price.
Therefore, traders need to remain cautions while using this indicator in the trendless market to avoid losing thier capital.
Banker Chip (Red bar) represents the banker's start engaging in the collection phase, while the Banker Washout (Green bar) represents the banker's washout to accumulate more chips.
Thus, if a Red bar is found near the end of a stock's decline, there is a high probability will form a wave of a rebound.
The last bar method is what it's called.
The Pump (Purple bar) represents the banker boosting up the stock price to attract regular investors.
The Dump (Yellow bar) represents regular investors committed to the stock, which is banker profit-taking activity (dump) that may result the price to collapse later.
The Capitulation Zone is when investors give up the stock by selling all the positions during periods of decline. It is a hint of bottom in pricing and consequently a good opportunity to observe whether can form a mark up phase (higher pivot highs and higher pivot lows)
The Risk Level Line (RLL) represents the risk level zone from horizontal 0 to 100. When the RLL rises beyond 80, it is considered a risk zone, may lead to a downward move.
Thus, investors who intend to enter the market at the bottom might use 20 as a safety zone and pay attention to the stock's trend in the future.
Banker Chip Pro features a total of 3 signals which are ⏫️ push signal and 🚀 hot money signal for bottom strategy and ⏬️ dump signal for an exit strategy.
This is referred to as signal method.
僅限邀請腳本
僅作者批准的使用者才能訪問此腳本。您需要申請並獲得使用許可,通常需在付款後才能取得。更多詳情,請依照作者以下的指示操作,或直接聯絡magicswings。
TradingView不建議在未完全信任作者並了解其運作方式的情況下購買或使用腳本。您也可以在我們的社群腳本中找到免費的開源替代方案。
作者的說明
Please send request for this indicator by text message.
免責聲明
這些資訊和出版物並非旨在提供,也不構成TradingView提供或認可的任何形式的財務、投資、交易或其他類型的建議或推薦。請閱讀使用條款以了解更多資訊。
僅限邀請腳本
僅作者批准的使用者才能訪問此腳本。您需要申請並獲得使用許可,通常需在付款後才能取得。更多詳情,請依照作者以下的指示操作,或直接聯絡magicswings。
TradingView不建議在未完全信任作者並了解其運作方式的情況下購買或使用腳本。您也可以在我們的社群腳本中找到免費的開源替代方案。
作者的說明
Please send request for this indicator by text message.
免責聲明
這些資訊和出版物並非旨在提供,也不構成TradingView提供或認可的任何形式的財務、投資、交易或其他類型的建議或推薦。請閱讀使用條款以了解更多資訊。