Williams VIX For Bottoms [DCD]Williams VIX Original - Authentic Volatility Fear Gauge
What This Indicator Does
The Williams VIX Fix measures market fear by calculating how far current lows deviate from recent highs, identifying potential market bottoms during high volatility periods. This implementation provides Larry Williams' original formula in its purest form.
How It Works
Core Formula:
VIX Fix = ((Highest High over 22 periods - Current Low) / Highest High over 22 periods) × 100
The calculation process:
Measures Relative Distance: Compares current low to highest high over lookback period
Converts to Percentage: Normalizes values for cross-market comparison
Applies Statistical Analysis: Uses Bollinger Bands (2 std dev) around VIX Fix values
Filters with Percentiles: 85th percentile threshold removes noise
Signal Generation
Green Flash Signals trigger when either condition is met:
VIX Fix exceeds upper Bollinger Band (2 standard deviations above 20-period MA)
VIX Fix exceeds Range High (85th percentile of recent values)
This dual-condition approach reduces false signals while capturing genuine volatility spikes.
What Makes This Original
Pure Formula Implementation: Uses Williams' exact original calculation without modifications
Dual Confirmation System: Combines Bollinger Bands with percentile analysis
Professional Visualization: Histogram display, background highlighting, and live value table
Comprehensive Alerts: Signal start/end notifications plus Green Flash alerts
How to Use
Primary Purpose: Spot high-probability reversal zones during market fear climaxes
Signal Interpretation:
Green triangle + background highlight = High volatility reversal zone
Higher VIX Fix values = Stronger fear/better reversal potential
Use with price action confirmation for best results
Optimal Settings:
Timeframes: 4H, Daily, Weekly
Markets: All (stocks, crypto, forex, commodities)
Combine with support levels and candlestick patterns
Key Parameters:
VIX Fix Length (22): Lookback period for highest high
Std Dev Multiplier (2.0): Bollinger Band sensitivity
Percentile High (0.85): Only top 15% of readings trigger signals
The VIX Fix excels at identifying market fear climaxes that coincide with significant price bottoms, making it valuable for swing traders seeking high-probability entries during market stress.
Bottomfinder

Up and Downwhat is "Up and Down"?
It is an indicator designed to show you in detail on the chart and warn you when there is an increase or decrease in the market at a level that you consider important.
what it does?
When the price difference between a top and bottom is greater than the level you selected (the default input is 10 percent), it indicates this along with the percentage value on the chart. Then, it indicates the start and end points with lines so that you can see the change from where to where. It shows the price's current percentage distance from the last bottom or top in the upper right corner.
it also colors the candles so you can better understand how fast the price is moving. The greener the candles, the stronger the rise, and conversely, the greater the decline, the redder the candles. Of course, if you set an alarm, it will tell you in which trading pair, in which time period, at what percentage and in which direction there is a movement.
how it does it?
It uses a moving average with a short length to find bottoms and tops. It then measures the distance from the last peak to the bottom and expresses it as a percentage. It uses momentum using the moving average as a source to paint the candles. To compress this momentum between the values 255 and 0, I used a formula that I also used in my limited fisher transform work (because the inputs in the color.rgb function take values between 0 and 255). It was a bit challenging to use the lines correctly, but with the "ta.valuewhen" function and a little experimenting, they were I made sure they were drawn correctly.
how to use it?
It is quite simple to use. First, select the minimum interval you want to receive alarms. If you make this value too high, you will not receive any alarms; if you make it too low, you will receive too many alarms. Choose the range that will benefit you most for the trading pair you are using. Then all you have to do is set an alarm. When you set an alarm, leave the note section blank and the indicator will send you the necessary information.

Dynamic Momentum GaugeOverview
The Dynamic Momentum Gauge is an indicator designed to provide information and insights into the trend and momentum of a financial asset. While this indicator is not directional , it helps you know when there will be a trend, big move, or when momentum will have a run, and when you should take profits.
How It Works
This indicator calculates momentum and then removes the negative values to focus instead on when the big trend could likely happen and when it could end, or when you should enter a trade based on momentum or exit. Traders can basically use this indicator to time their market entries or exits, and align their strategies with momentum dynamics.
How To Use
As previously mentioned, this is not a directional indicator but more like a timing indicator. This indicator helps you find when the trend moves, and big moves in the markets will occur and its possibly best to exit the trades. For example, if you decide to enter a long trade if the Dynamic Momentum Gauge value is at an extreme low and another momentum indicator that you use has conditions that you would consider to long with, then this indicator is basically telling you that there isn't more space for the momentum to squeeze any longer, can only really expand from that point or stay where it currently is, but this is also a mean reverting process so it does tend to go back up from the low point.
Settings:
Length: This is the length of the momentum, by default its at 100.
Normalization Length: Length of the Normalization which ensures the the values fall within a consistent range.

Horns Pattern Identifier [LuxAlgo]The following script detects regular and inverted horn patterns. Detected patterns are displayed alongside their respective confirmation and take profit levels derived from the pattern measure rule. Breakout of the confirmation levels are highlighted with labels.
This script is a continuation of the educational idea regarding horns patterns.
Settings
Threshold: Controls the maximum allowed slope of the line connecting two horns, with higher values allowing a higher slope.
Usage
Horn patterns are chart patterns introduced by Bulkowski in his book "Encyclopedia of Chart Patterns". We covered this pattern in the following post: Horn Tops & Bottoms Patterns - How To Find and Trade Them
The script allows the user to quickly determine the presence of a regular or inverted horn pattern, alongside automatically displaying the confirmation level and take profits associated with a detected pattern. These are calculated based on the rules described by Bulkowski.
Horn patterns are highlighted by a line connecting the horns, the dotted lines represent the confirmation level, once the price crosses this level a label will appear, either bullish or bearish depending on the detected pattern. The dashed line represents the take profit level.

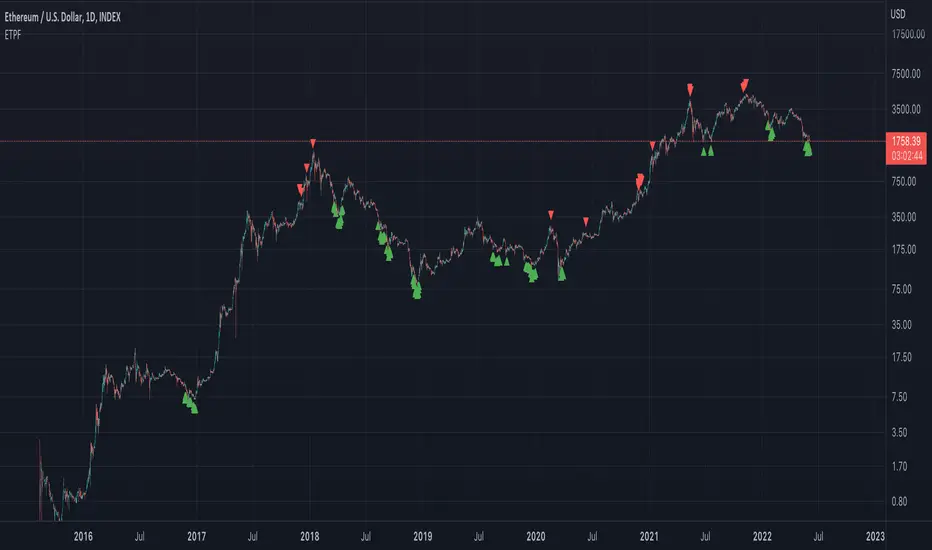
Exponential Top and Bottom FinderThis is an indicator to identify possible tops and bottoms after exponential price surges and drops, it works best on ETH 1D, but you can also use it for bitcoin and altcoins.
It's based on stochastic first and second derivatives of a close moving average
Bitcoin Golden Bottom Oscillator (MZ BTC Oscillator)This indicator uses Elliot Wave Oscillator Methodology applied on "BTC Golden Bottom with Adaptive Moving Average" and Relative Strength Index of Resulted EVO to form an Oscillator to detect trend health in Bitcoin price. Ticker is set to "INDEX : BTCUSD" on 1D timeframe.
Methodology
Oscillator uses Adaptive Moving Average with 1 year of length, Minor length of 50 and Major length of 100 to mark AMA as Golden Bottom.
Percentage Elliot Wave Oscillator is calculated between BTC price and AMA.
Relative Strength Index of EVO is calculated to detect trend strength and divergence detection.
Hull Moving Average of resulted RSI is used to smoothen the Oscillator.
Oscillator is hard coded to 'INDEX:BTCUSD' ticker on 1d so it can be used on any other chart and on any other timeframe.
Color Schemes
Bright Red background color indicates that price has left top Fib multiple ATR band and possibly go for top.
Light Red background color indicates that price has left 2nd top Fib multiple ATR band and possibly go for local top.
Lime background color indicates that price has entered lowest band indicating local bottom.
Bright Green background color indicates that price is approximately resting on Golden Bottom i.e. AMA.
Oscillator color is set to gradient for easy directional adaption.
BTC Golden Bottom with Adaptive Moving Average

Noro's BottomSensivity v0.6 strategy + rsi + AlarmThe original indicator is Noro's BottomSensivity v0.6
I simply turned noro's bottom sensibility 6.0 indicator, which I consider a great tool to find market bottom, into a strategy.
I also added an additional RSI filter with inputs that can be set by the user for entry and exit from the market.
I have tried to insert an alarm so that I can be notified when this particular purchase condition is formed.
I also tried to insert an additional filter that would allow me to make further pyramid purchases only after a certain percentage of drawdown from the first entry so as to reduce the average purchase price but I was not able ... if someone could implement this I would appreciate it.
Well..this is the first time that I try to program / modify a strategy / indicator, there are certainly some gross errors (as in my English too), please forgive me, I will appreciate the corrections that more experienced users will want to make.
I wish you all a good day, pfjons

NVT Dynamic Colored with Signals [aamonkey]NVT Dynamic
This is the dynamic version of my " Bitcoin Network Value to Transactions " indicator.
The dynamic NVT indicator is based on the Network Value to Transactions.
Definition:
NVT = Network Value / Daily Transaction Volume
Advantages:
Because BTC is a very young asset, it can be a good idea to have relatively high and low NVT values that change over time.
Signals:
When the NVT turns green = buy opportunity
NVT turns red = sell opportunity

Bitcoin Network Value to Transactions [aamonkey]Cryptoassets have been quite turbulent in the past few weeks.
At times like this, it is especially important to look at the fundamental foundations of cryptoassets.
This indicator is based on the Network Value to Transactions , or NVT .
Definition:
NVT = Network Value / Daily Transaction Volume
Because this indicator is pulling the Daily Transaction Volume for BTC it can only be used for BTC and the daily timeframe.

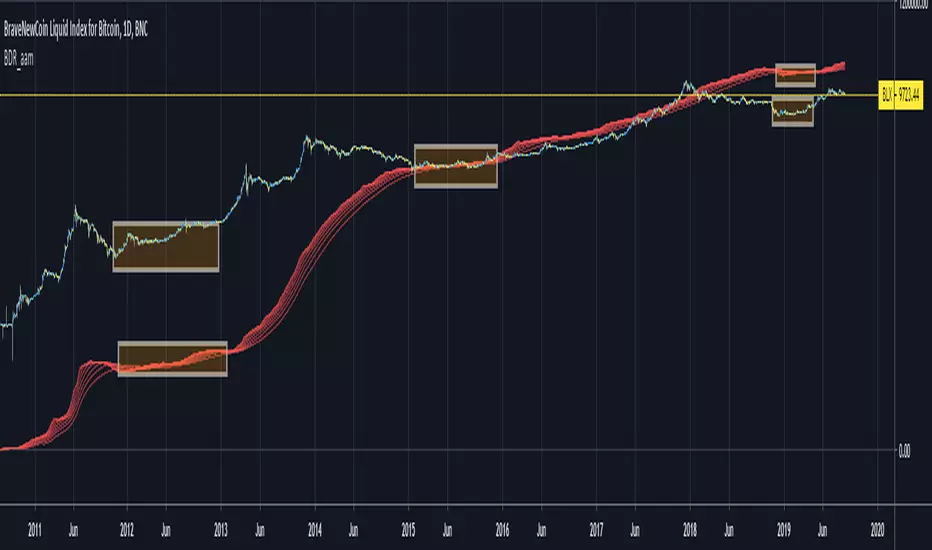
Bitcoin Difficulty Ribbon [aamonkey]This is another tool to find big cycle bottoms that is very unknown yet effective.
The Difficulty Ribbon speaks to the impact of miner selling pressure on Bitcoin`s price action.
When network difficulty reduces its rate of climb, miners are going out of business, leaving only the strong miners who proportionally need to sell less of their coins to remain operational, this leads to less sell pressure and more room for bullish price action.
The best times to buy Bitcoin are zones where the ribbon compresses.
The ribbon consists of simple moving averages of Bitcoin network difficulty so the rate of change of difficulty can be easily seen.
RSI Top & Bottom Warning [aamonkey]An enhancement of my RSI Bottom Indicator.
This one finds you Tops & Bottoms.
This indicator uses the RSI and prints you top & bottom warnings directly on the price chart.
The other special thing about this is that the RSI pulls the data from the weekly chart no matter on what timeframe you are on.
The preferred timeframe can, of course, be changed in the settings as well as any thresholds for tops and bottoms.
The default settings are very good for btc, but be free to try and test this indicator with different settings on different charts.

RSI Bottom [aamonkey]This is a modified RSI that prints a bottom signal directly on your price chart.
It pulls the data (in the default settings) from the weekly chart no matter on what timeframe you are on.
You can adjust the timeframe and threshold.
Default settings work best for big BTC cycles.

TOP & BOTTOM Cycle [aamonkey]Works best on BTC and only on the daily timeframe!
This is a TOP / BOTTOM indicator for big market cycles.
These tops and bottoms are based on the difference between the 200MA on the daily and the price.

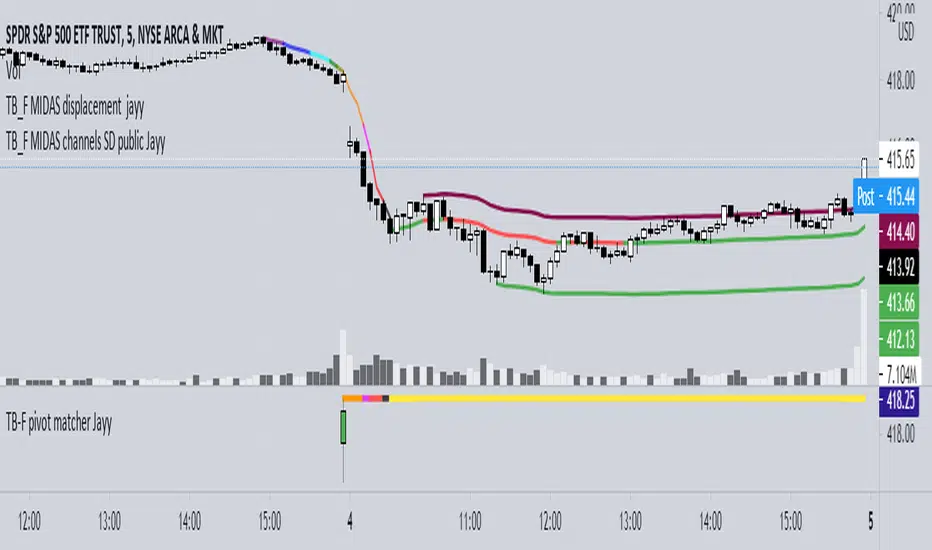
Topfinder Bottomfinder pivot matcher Midas- jayyMidas Technical Analysis: A VWAP Approach to Trading and Investing in Today’s Markets by
Andrew Coles, David G. Hawkins Copyright © 2011 by Andrew Coles and David G. Hawkins.
Appendix C: TradeStation Code for the MIDAS Topfinder/Bottomfinder Curves ported to tradingview
This code is used to assist in adjusting D volume to intersect pivot candle at a pivot candle when using this script: Top Bottom Finder Public version- Jayy found here:
The "n" number entered into the TB-F script is the topfinder/bottomfinder starting point or anchor
Be sure to enter the correct number in the "Topfinder bottomfinder initiation/anchor candle: 1 for CANDLE low - top finder, 2 for CANDLE high - bottom finder, 3 for CANDLE MIDPOINT (hl2) dialogue box
The location of the match point of the pivot candle is extremely important in the: "Match to PIVOT CANDLE: use 1 for CANDLE low, 2 for midtail of the candle below the BODY, 3 for candle BODY low, 4 for CANDLE HIGH, 5 for midpoint of candletail above body, 6 for candle BODY high". Do not
confuse body high with candle high. The body low will either be the candle open or close. The body high will be either the open or close.
If you expect a trend up the pivot candle is likely the low of the pivot candle ie 1 (2 and 3 are alternatives).
In a trend down the high of the pivot candle is often selected ie 4 (5 or 6 are alternatives)
If the candle body is aqua increase D volume if it is orange reduce D volume. Adjust iteratively until the candle body turns yellow. That will mean that the TB-F line passes through the pivot candle at the selected point.
Jayy

Top Bottom Finder Public version- Jayy This script plots a 6 algos from the Coles/Hawkins "Midas Technical Analysis" book:
Top finder / Bottom Finder (Levine Algo by Bob English)* - onlinelibrary.wiley.com
MIDAS VWAP Gen-1) -
MIDAS VWAP average and deltas
VWAP (Gen-1) using a date or a bar n number can be initiated at bar 0 - useful for a new IPO
Standard Deviation of MIDAS VWAP
MIDAS Displacement Channels (Coles) - edmond.mires.co
An%20Anchored%20VWAP%20Channel%20For%20Congested%20Markets.pdf
* for better results with topfinder and bottomfinder use the companion TB-F Matcher script.
See wiki for a synopsis: en.wikipedia.org
Relevant info can be found in: Midas Technical Analysis: A VWAP Approach to Trading and Investing in Today’s Markets by
Andrew Coles, David G. Hawkins Copyright © 2011 by Andrew Coles and David G. Hawkins.
Appendix C: TradeStation Code for the MIDAS Topfinder/Bottomfinder Curves ported to Tradingview
This script requires a working understanding of "Midas Technical Analysis" Google "Midas Technical Analysis" and a variety of information will appear.
To find fit the curve as described in the Midas book a companion script is required that will after a few manual iterative inputs guide you to the appropriate D value for the for input into this program ( see the TB-F Matcher script). You might also try the Midas average and Deltas as described in the book. I have added the 2nd, 3rd and 4th multiples of Delta.
The advantage is that there is no curve fitting. You still need to select a starting point for Midas or the topfinder bottomfinder (TB_F)
or the VWAP.
////////////////////////////////////////////////////////////////////////////////////////////////////////////////////////////
See the notes in the script below
Cheers Jayy