OPEN-SOURCE SCRIPT
200WMA Screener
Description:
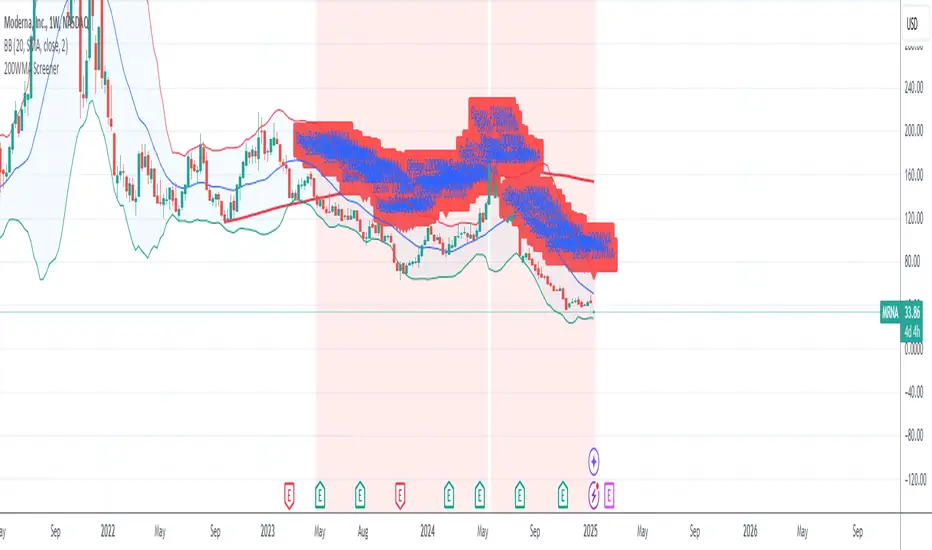
This custom indicator helps identify stocks trading below their 200-week moving average (200WMA), a key technical indicator often used to analyze long-term trends. The script calculates the 200WMA using weekly close prices and provides the following features:
Visual Plot: Displays the 200WMA as a smooth line on the chart for easy trend analysis.
Background Highlight: Automatically highlights the chart background when the current price is below the 200WMA, signaling a potential bearish trend or undervalued stock.
Alert System: Includes an alert condition to notify you when a stock trades below its 200WMA, so you never miss an opportunity.
Compatibility: Works across all assets (stocks, forex, crypto) and automatically adapts to the selected ticker.
This script is ideal for traders and investors looking for long-term opportunities, identifying potential trend reversals, or spotting undervalued stocks.
開源腳本
秉持TradingView一貫精神,這個腳本的創作者將其設為開源,以便交易者檢視並驗證其功能。向作者致敬!您可以免費使用此腳本,但請注意,重新發佈代碼需遵守我們的社群規範。
免責聲明
這些資訊和出版物並非旨在提供,也不構成TradingView提供或認可的任何形式的財務、投資、交易或其他類型的建議或推薦。請閱讀使用條款以了解更多資訊。
免責聲明
這些資訊和出版物並非旨在提供,也不構成TradingView提供或認可的任何形式的財務、投資、交易或其他類型的建議或推薦。請閱讀使用條款以了解更多資訊。