OPEN-SOURCE SCRIPT
3 EMA/SMA + Colored Candles[C2Trends]
// Indicator Features:
// 1) 3 Exponential Moving Averages and 3 Simple Moving Averages.
// 2) Additional EMA input for colored candles(EMA is hidden from chart, input used for coloring of candles only)
// 3) Turn colored candles on/off from main input tab of indicator settings.
// 4) Turn SMA's and EMA's on/off from main input tab of indicator settings.
// 5) Select single color or 2 color EMA and SMA lines from main input tab of indicator settings.
// Indicator Notes:
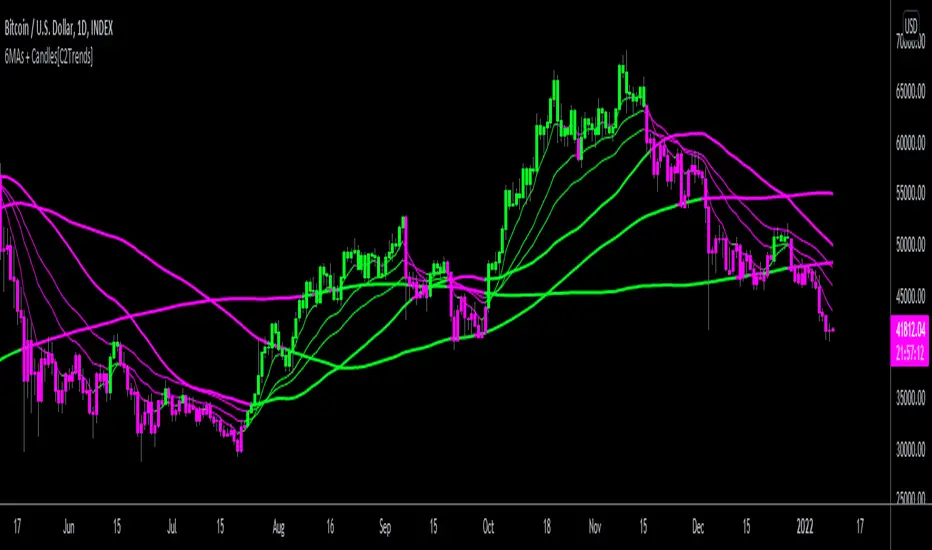
// 1) 'Candle EMA' input is the trend lookback period for the price candle colors. When price is above desired Candle EMA, price candles will color green. When price is below the Candle EMA, price candles will color fuchsia.
// 2) If you are using another indicator that colors the price candles it may overlap the candle colors applied by this indicator. Trying hiding or removing other indicators to troubleshoot if having candle color issues.
// 3) Using 2-color price moving averages: when price is above an average the average will color green, when price is below an average the average will color fuchsia.
// 1) 3 Exponential Moving Averages and 3 Simple Moving Averages.
// 2) Additional EMA input for colored candles(EMA is hidden from chart, input used for coloring of candles only)
// 3) Turn colored candles on/off from main input tab of indicator settings.
// 4) Turn SMA's and EMA's on/off from main input tab of indicator settings.
// 5) Select single color or 2 color EMA and SMA lines from main input tab of indicator settings.
// Indicator Notes:
// 1) 'Candle EMA' input is the trend lookback period for the price candle colors. When price is above desired Candle EMA, price candles will color green. When price is below the Candle EMA, price candles will color fuchsia.
// 2) If you are using another indicator that colors the price candles it may overlap the candle colors applied by this indicator. Trying hiding or removing other indicators to troubleshoot if having candle color issues.
// 3) Using 2-color price moving averages: when price is above an average the average will color green, when price is below an average the average will color fuchsia.
開源腳本
秉持TradingView一貫精神,這個腳本的創作者將其設為開源,以便交易者檢視並驗證其功能。向作者致敬!您可以免費使用此腳本,但請注意,重新發佈代碼需遵守我們的社群規範。
免責聲明
這些資訊和出版物並非旨在提供,也不構成TradingView提供或認可的任何形式的財務、投資、交易或其他類型的建議或推薦。請閱讀使用條款以了解更多資訊。
開源腳本
秉持TradingView一貫精神,這個腳本的創作者將其設為開源,以便交易者檢視並驗證其功能。向作者致敬!您可以免費使用此腳本,但請注意,重新發佈代碼需遵守我們的社群規範。
免責聲明
這些資訊和出版物並非旨在提供,也不構成TradingView提供或認可的任何形式的財務、投資、交易或其他類型的建議或推薦。請閱讀使用條款以了解更多資訊。