OPEN-SOURCE SCRIPT
已更新 Willams %RwEMA
Was looking for something else when surfed into an old question
wanting %R 21 period with EMA 13 period of the %R signal
and being a rookie at this, made this code to post for them.
Tried to comment the script in such a way that other rookies
like me could make better sense of what is being done. Hope
this helps someone. I find it useful as one of my indicators for
trading.
Pinescript for tradingview.com user Tom1trader
All time frames.
Interpretation:
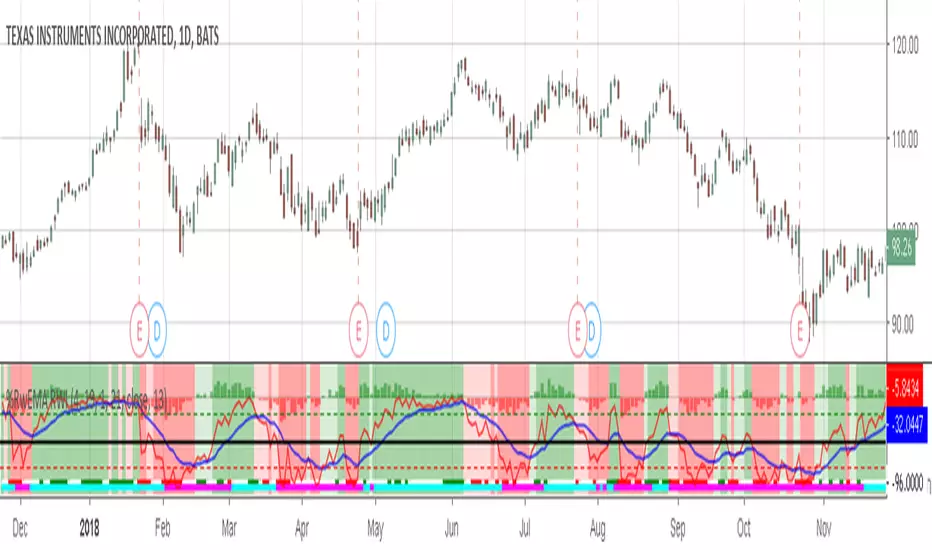
%R (Red) crosses above it's average (Blue) - bull
%R crosses below it's average - bear. Background
color changes green-up red-down with above crossings.
Most but not all of serious price movement takes place
from the time the %R (red) goes into oversold (or bought) and
exits again.
%R centerline crosses can also be useful.
I use various indicators and want all of the confirmation
that I can get for expectations BUT I never know what the
next bar will do and define my risks accordingly.
發行說明
https://www.tradingview.com/chart/OsBXckpZ/Added 2 new lines at the top of the panel. Each of them is a Random Walk Indicator.
The top one is an adjustable short period (default 4) with an adjustable threshold (default 1). When the RWhighs or RWlows exceed 1 it is said to be not random and a possible trend. It is RED, GREEN or WHITE for threshold met down, threshold met up and threshold not met (presumably still random).
The second one is a high/low cross only with an adjustable longer period (default 19) to stand out from the background it switches from AQUA (up) to FUCHSIA (down) when the RWhighs and RWlows cross each other up or down. Even though it does not use a threshold it makes a good general trend indication. Since they lie just above and below each other; together they give a good visualization of this different aspect of price action. Possibly because of the I find it complements the other indicators in the mix without just telling me the same thing.
I had not known of this one so thanks to user RicardoSantos for the idea, the link to more info that is on his indicator and for the Random Walk Function that I used from his indicator which is here:
![[RS]Random Walk Index](https://s3.tradingview.com/r/r5boCqSs_mid.png)
Refined the background colors for a quick read of percentR. The background colors now key to the RED signal line above or below the BLUE moving average line and the signal line above or below center. Signal above Average - Green, also above center - Darker Green. Signal below Average - red and center -darker red. The higher (lower) the Signal and Average, especially at or above (below) the 80/20 lines the more price movement is occurring.
發行說明
Updates 12-3-2-18:1. Moved the colored lines representing Random Walk to the bottom of the panel (thanks again RicardoSanto)
2. Added a histogram at the top of the panel to show the difference between the %R and its ema average. Thanks user TransitMan for request.
3. Updated and hopefully clarified the description given in comments at the start of the script.
If it helps you trade or gives you some script ideas, great - this is provided for entertainment purposes only.
Enjoy, happy trading and keep smiling!
開源腳本
秉持TradingView一貫精神,這個腳本的創作者將其設為開源,以便交易者檢視並驗證其功能。向作者致敬!您可以免費使用此腳本,但請注意,重新發佈代碼需遵守我們的社群規範。
免責聲明
這些資訊和出版物並非旨在提供,也不構成TradingView提供或認可的任何形式的財務、投資、交易或其他類型的建議或推薦。請閱讀使用條款以了解更多資訊。
開源腳本
秉持TradingView一貫精神,這個腳本的創作者將其設為開源,以便交易者檢視並驗證其功能。向作者致敬!您可以免費使用此腳本,但請注意,重新發佈代碼需遵守我們的社群規範。
免責聲明
這些資訊和出版物並非旨在提供,也不構成TradingView提供或認可的任何形式的財務、投資、交易或其他類型的建議或推薦。請閱讀使用條款以了解更多資訊。