OPEN-SOURCE SCRIPT
已更新 LinReg Heikin Ashi Candles
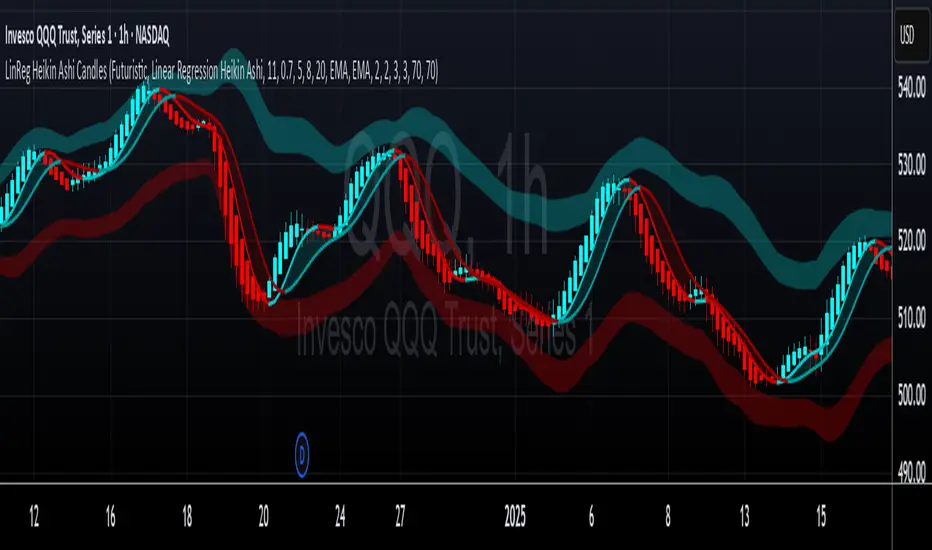
Linear Regression Heikin Ashi Candles will dramatically change how the candlesticks on your chart will appear. This script creates Heikin Ashi candles from the existing candlesticks and then applies wickless Linear Regression candles as an overlay. The result is an ultra smoothed 'Renko-like' chart that remains time-based and responsive.
Key Features:
How to Use:
This is an overlay on your chart so you'll need to 'hide' the existing candlesticks on your chart.
This indicator can be used on any timeframe from seconds to days to quickly identify market trend, gauge volatility, and potentially find entry/exit points. Consider looking for confluence between the candle color/direction, T3 MA crossovers, and price interaction with the Volatility Bands.
Note: This indicator plots Linear Regression directly on Heikin Ashi candles, removing wicks for a focus on the linear trend within the smoothed data. Adjust the input parameters to suit your trading style and the specific market conditions.
HUGE CREDIT to ugurvu who originally created the Linear Regression Candles indicator that my indicator pulls code from.
Key Features:
- Heikin Ashi Base: Provides a smoother representation of price trends by filtering out noise.
- Linear Regression Candles on Heikin Ashi: Plots Linear Regression lines as candles on the Heikin Ashi chart, potentially highlighting the immediate trend direction and momentum within the smoothed data. Wicks are intentionally removed for a clearer focus on the linear progression.
- Tillson T3 Moving Averages: Includes fast and slow T3 Moving Averages with customizable length and alpha. These smoothed moving averages can help identify trend direction and potential crossover signals. Users can toggle their visibility.
- Volatility Bands: Integrates Volatility Bands based on Average True Range (ATR) with customizable length, ATR type (RMA, SMA, EMA, WMA), and inner/outer multipliers. These bands help gauge price volatility and potential reversal zones. Users can toggle the visibility of the basis line.
- Customizable Colors: Allows users to customize the colors of the Linear Regression Heikin Ashi bullish and bearish candles.
How to Use:
This is an overlay on your chart so you'll need to 'hide' the existing candlesticks on your chart.
This indicator can be used on any timeframe from seconds to days to quickly identify market trend, gauge volatility, and potentially find entry/exit points. Consider looking for confluence between the candle color/direction, T3 MA crossovers, and price interaction with the Volatility Bands.
Note: This indicator plots Linear Regression directly on Heikin Ashi candles, removing wicks for a focus on the linear trend within the smoothed data. Adjust the input parameters to suit your trading style and the specific market conditions.
HUGE CREDIT to ugurvu who originally created the Linear Regression Candles indicator that my indicator pulls code from.
發行說明
Added the ability to disable volatility bands and T3 moving averages in settings for those who would like to only the candles overlay.發行說明
- Added additional volatility band basis types (ALMA, KAMA, EMA, WMA, SMA, LSMA, HMA)- Improved volatility band fit
- Added basis buy/sell arrows on candle direction change (disabled by default, enable in settings)
發行說明
Added alerts for candle direction changes and T3 moving average crossovers. Minor correction to volatility bands.
發行說明
Short title correction. Color matching.
發行說明
Added color customization for the custom volatility bandsVolatility bands now default to EMA for basis
Added color customization for the sell signal
Changed slow TA moving average default from 9 to 8
Improved organization of the settings options
Various fixes and minor changes
發行說明
Added adjustable transparency for volatility bandsAdded color themes
Added ability to enable linear regression candle wicks
發行說明
Updated color themesAdded futuristic color theme
發行說明
- Users can now select from Linear Regression Heikin Ashi, Linear Regression, Heikin Ashi from the settings menu
- T3 is now correctly assigned to values for the selected candle type
- Slight correctly to volatility band candle value calculation
- Adjusted volatility band default values to match the above fix
發行說明
- Performance optimizations
- Added 'Reduce Heikin Ashi Lag' for slightly improved HA responsiveness
- Added 'Reduce Linear Regression Lag' for improved LR responsiveness
- Added Extend Wick To Current Price
開源腳本
秉持TradingView一貫精神,這個腳本的創作者將其設為開源,以便交易者檢視並驗證其功能。向作者致敬!您可以免費使用此腳本,但請注意,重新發佈代碼需遵守我們的社群規範。
discord.gg/REapC6SGtz
b3artrades@gmail.com
b3artrades@gmail.com
免責聲明
這些資訊和出版物並非旨在提供,也不構成TradingView提供或認可的任何形式的財務、投資、交易或其他類型的建議或推薦。請閱讀使用條款以了解更多資訊。
開源腳本
秉持TradingView一貫精神,這個腳本的創作者將其設為開源,以便交易者檢視並驗證其功能。向作者致敬!您可以免費使用此腳本,但請注意,重新發佈代碼需遵守我們的社群規範。
discord.gg/REapC6SGtz
b3artrades@gmail.com
b3artrades@gmail.com
免責聲明
這些資訊和出版物並非旨在提供,也不構成TradingView提供或認可的任何形式的財務、投資、交易或其他類型的建議或推薦。請閱讀使用條款以了解更多資訊。