OPEN-SOURCE SCRIPT
已更新 CVD Oscillator

CVD Delta Oscillator
A momentum oscillator that measures buying and selling pressure through volume analysis, based on the principle that volume precedes price (cause and effect).
How It Works
Volume Analysis
Measures the force of buying and selling by analyzing how volume interacts with price movement within each bar
When price closes higher in a bar's range with strong volume, this indicates stronger buying pressure
When price closes lower in a bar's range with strong volume, this indicates stronger selling pressure
Momentum Measurement
Signal Generation
Divergences
Bullish: Price falls to new lows while buying pressure increases (potential reversal up)
Bearish: Price rises to new highs while selling pressure increases (potential reversal down)
Zero-Line Crossovers
Bullish: Buying pressure overtakes selling pressure
Bearish: Selling pressure overtakes buying pressure
Practical Application
Reading the Indicator
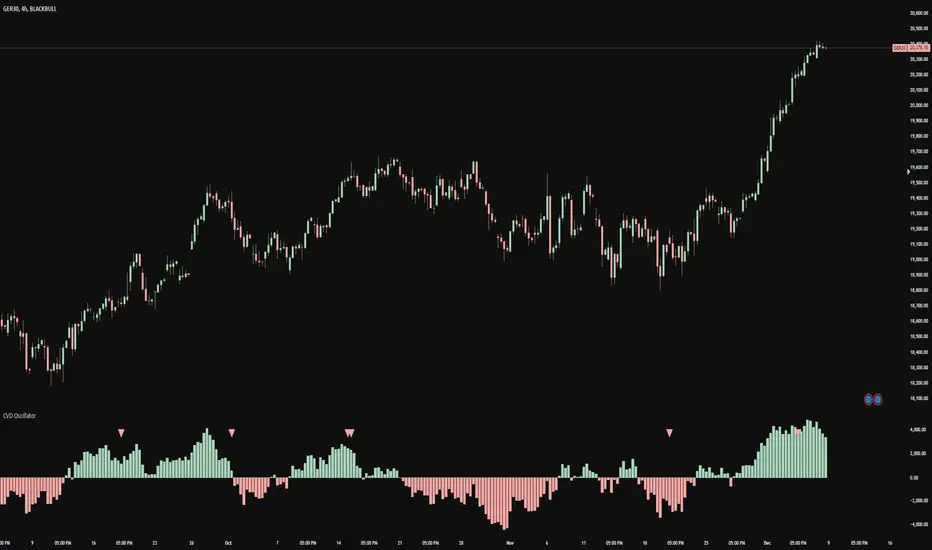
Green columns above zero = Net buying pressure
Red columns below zero = Net selling pressure
Larger columns = Stronger pressure
Divergences and crossovers = Potential turning points
Trading Context
Helps identify when price movement has strong or weak volume support
Shows potential exhaustion points through divergences
Confirms trend changes through zero-line crossovers
Customization
Adjustable EMA periods for different trading styles
Toggle-able visual signals
Automatic alerts for all signals
A momentum oscillator that measures buying and selling pressure through volume analysis, based on the principle that volume precedes price (cause and effect).
How It Works
Volume Analysis
Measures the force of buying and selling by analyzing how volume interacts with price movement within each bar
When price closes higher in a bar's range with strong volume, this indicates stronger buying pressure
When price closes lower in a bar's range with strong volume, this indicates stronger selling pressure
Momentum Measurement
- Uses two EMAs (fast and slow) to smooth the volume delta
- The difference between these EMAs creates an oscillator that shows:
- Rising values = Buying pressure increasing
- Falling values = Selling pressure increasing
- Zero line crossovers = Potential shift in control between buyers and sellers
Signal Generation
Divergences
Bullish: Price falls to new lows while buying pressure increases (potential reversal up)
Bearish: Price rises to new highs while selling pressure increases (potential reversal down)
Zero-Line Crossovers
Bullish: Buying pressure overtakes selling pressure
Bearish: Selling pressure overtakes buying pressure
Practical Application
Reading the Indicator
Green columns above zero = Net buying pressure
Red columns below zero = Net selling pressure
Larger columns = Stronger pressure
Divergences and crossovers = Potential turning points
Trading Context
Helps identify when price movement has strong or weak volume support
Shows potential exhaustion points through divergences
Confirms trend changes through zero-line crossovers
Customization
Adjustable EMA periods for different trading styles
Toggle-able visual signals
Automatic alerts for all signals
發行說明
The CVD (Cumulative Volume Delta) Oscillator is an advanced momentum indicator that combines volume analysis with price action to measure buying and selling pressure. This indicator is designed to identify potential market reversals and trend shifts by analyzing the relationship between volume and price movement.### Core Components & Methodology
1. **Volume Delta Analysis**
- Calculates the force of buying/selling pressure within each bar
- Uses a sophisticated formula: volume * (close - open) / (high - low)
- Positive values indicate buying pressure (price closing in upper range)
- Negative values indicate selling pressure (price closing in lower range)
2. **Dual EMA System**
- Short-term EMA (default: 34 periods) captures immediate momentum
- Long-term EMA (default: 200 periods) establishes baseline pressure
- The difference creates an oscillator showing net buying/selling pressure
### Signal Generation & Analysis
1. **Volume-Price Divergences**
- Bullish Divergence: Price makes lower lows while CVD makes higher lows
* Indicates potential buying pressure building despite price decline
* Often precedes bullish reversals
- Bearish Divergence: Price makes higher highs while CVD makes lower highs
* Shows weakening buying pressure despite price increase
* Signals potential distribution phase
2. **Zero-Line Dynamics**
- Crossover Above Zero: Buying pressure overtakes selling pressure
- Crossunder Below Zero: Selling pressure overtakes buying pressure
- Zero-line acts as a dynamic "control line" between buyers and sellers
### Unique Features & Innovation
1. **Enhanced Volume Analysis**
- Goes beyond basic volume indicators by incorporating price position
- Measures the quality of volume, not just quantity
- Helps identify "smart money" accumulation/distribution
2. **Multiple Confirmation Signals**
- Combines trend, momentum, and volume analysis
- Provides both divergence and crossover signals
- Automatic alerts for all signal types
3. **Visual Clarity**
- Color-coded histogram for instant pressure recognition
- Clear divergence and crossover markers
- Customizable display options
### Practical Trading Applications
1. **Trend Analysis**
- Confirm trend strength through volume pressure
- Identify potential trend exhaustion
- Spot early trend reversal signals
2. **Entry/Exit Timing**
- Use divergences for counter-trend entries
- Zero-line crossovers for trend-following entries
- Volume pressure confirmation for existing positions
3. **Risk Management**
- Assess trade conviction through volume pressure
- Identify potential stop levels at key pressure points
- Manage position sizing based on signal strength
### Customization Options
- Adjustable EMA periods for different timeframes
- Toggle-able divergence signals
- Toggle-able zero-cross signals
- Automatic multi-condition alerts
- Color scheme customization
### Recommended Usage
Best utilized in conjunction with price action and support/resistance levels. The indicator excels in:
- Identifying potential reversal points
- Confirming trend strength
- Spotting institutional accumulation/distribution
- Providing early warning signals for trend shifts
This indicator combines volume analysis principles with momentum concepts to create a unique tool that helps traders understand the underlying pressure driving price movement. It's particularly effective for traders focused on trend reversals and institutional activity.
開源腳本
秉持TradingView一貫精神,這個腳本的創作者將其設為開源,以便交易者檢視並驗證其功能。向作者致敬!您可以免費使用此腳本,但請注意,重新發佈代碼需遵守我們的社群規範。
免責聲明
這些資訊和出版物並非旨在提供,也不構成TradingView提供或認可的任何形式的財務、投資、交易或其他類型的建議或推薦。請閱讀使用條款以了解更多資訊。
開源腳本
秉持TradingView一貫精神,這個腳本的創作者將其設為開源,以便交易者檢視並驗證其功能。向作者致敬!您可以免費使用此腳本,但請注意,重新發佈代碼需遵守我們的社群規範。
免責聲明
這些資訊和出版物並非旨在提供,也不構成TradingView提供或認可的任何形式的財務、投資、交易或其他類型的建議或推薦。請閱讀使用條款以了解更多資訊。