OPEN-SOURCE SCRIPT
VSA Volume Monitor
Description
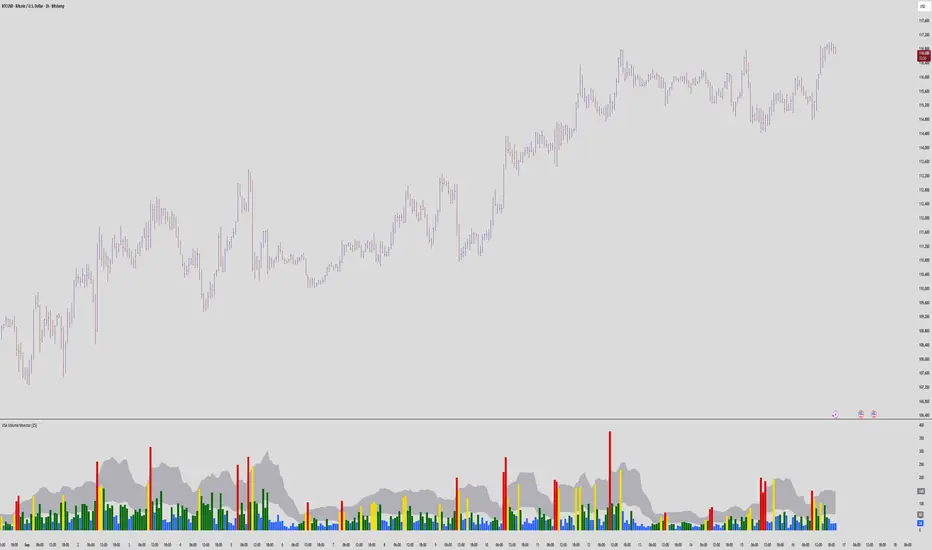
This script provides a clear and adaptable visual representation of volume activity, helping traders understand how current participation compares to recent norms.
It calculates a moving average of volume over a user-defined smoothing window and uses that baseline to classify each bar’s volume into several intensity levels.
Bars are color-coded to reflect these levels:
• Blue for below-average activity
• Green for moderate activity
• Yellow for above-average surges
• Red for exceptionally high or climactic volume
In addition to color-coded bars, the script plots two reference bands that represent the typical (baseline) and elevated (climactic) volume zones.
These bands form a shaded cloud that helps visually separate normal market participation from periods of unusual crowd activity or volatility.
The purpose of this indicator is purely visual and informational — it does not generate buy or sell signals, and it does not predict future price movement.
Instead, it gives traders an at-a-glance view of how market interest is shifting, so they can combine that context with their own analysis or strategy.
This tool is lightweight, easy to read, and designed for use alongside other forms of technical analysis, making it suitable for traders who want to build their own framework for understanding volume behavior.
開源腳本
秉持TradingView一貫精神,這個腳本的創作者將其設為開源,以便交易者檢視並驗證其功能。向作者致敬!您可以免費使用此腳本,但請注意,重新發佈代碼需遵守我們的社群規範。
免責聲明
這些資訊和出版物並非旨在提供,也不構成TradingView提供或認可的任何形式的財務、投資、交易或其他類型的建議或推薦。請閱讀使用條款以了解更多資訊。
開源腳本
秉持TradingView一貫精神,這個腳本的創作者將其設為開源,以便交易者檢視並驗證其功能。向作者致敬!您可以免費使用此腳本,但請注意,重新發佈代碼需遵守我們的社群規範。
免責聲明
這些資訊和出版物並非旨在提供,也不構成TradingView提供或認可的任何形式的財務、投資、交易或其他類型的建議或推薦。請閱讀使用條款以了解更多資訊。