OPEN-SOURCE SCRIPT
SMU STDEV Overlap Candles with Highest and Lowest
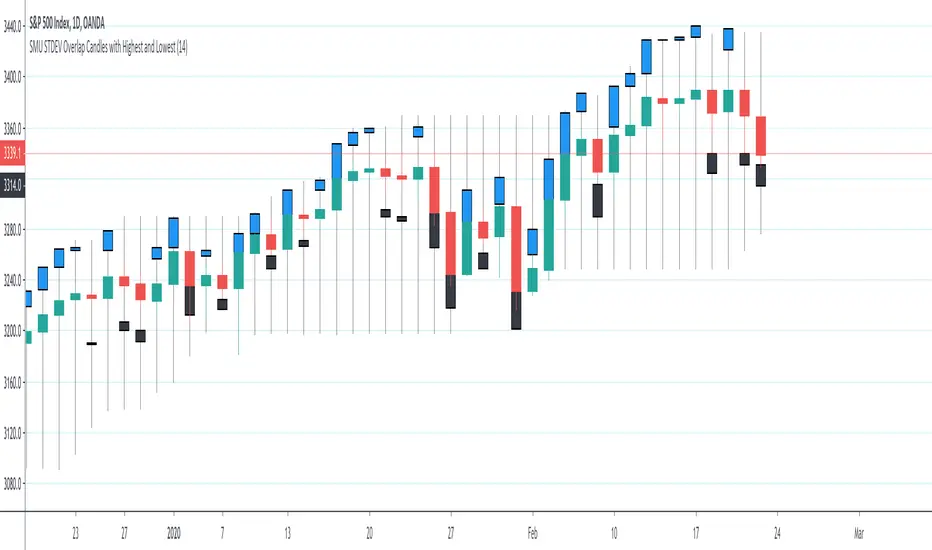
This script creates a STDEV in a candle format overlayed on the actual candles. The STDEV candles lead with deviation to upside or downside.
The Blue bars are Upside heads-up showing the strength of the uptrend before it happens.
The Black candles are downside indicators pulling on the price
I like price action because it is raw. So for High and Low I used the highest and lowest amount so when you trade you can see where the price is in relation to previous high and low
I use this script in conjunction with my first STDEV candles to get the full picture in short time frames. For example, when I see the STDEV of above 6 on change of direction then I trade on it before the trend begins and confirm it with STDEV overlay
If you have you been following my scripts you notice the code is very simple but the concept is very powerful. My hope is better pine script coders to build on these scripts and publish more out of the box type of scripts.
Enjoy
開源腳本
秉持TradingView一貫精神,這個腳本的創作者將其設為開源,以便交易者檢視並驗證其功能。向作者致敬!您可以免費使用此腳本,但請注意,重新發佈代碼需遵守我們的社群規範。
免責聲明
這些資訊和出版物並非旨在提供,也不構成TradingView提供或認可的任何形式的財務、投資、交易或其他類型的建議或推薦。請閱讀使用條款以了解更多資訊。
開源腳本
秉持TradingView一貫精神,這個腳本的創作者將其設為開源,以便交易者檢視並驗證其功能。向作者致敬!您可以免費使用此腳本,但請注意,重新發佈代碼需遵守我們的社群規範。
免責聲明
這些資訊和出版物並非旨在提供,也不構成TradingView提供或認可的任何形式的財務、投資、交易或其他類型的建議或推薦。請閱讀使用條款以了解更多資訊。