PROTECTED SOURCE SCRIPT
已更新 WSI FX Dashboard
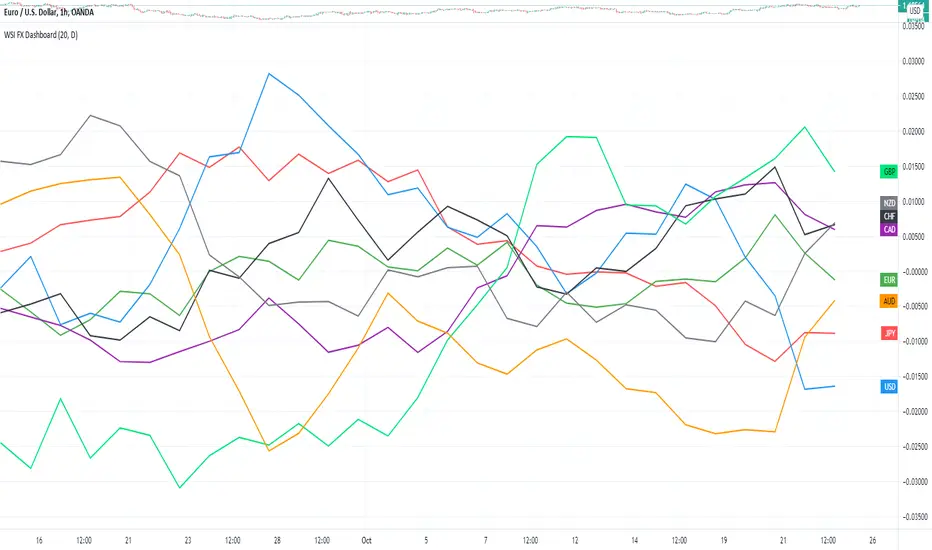
The WSI (Walton Strength Index) is a currency strength tool designed to show you how individual currencies are performing against each other.
It shows strength for 8 of the major currencies: USD, EUR, GBP, JPY, USD, CAD, AUD, NZD
Each of the lines corresponds to a currency, and you can use those readings to determine which currency pairs you would like to trade.
For example, if the EUR is higher than the rest of the currencies and the USD is lower than the rest of the currencies, then you may consider only buying on the EURUSD.
Don't look at this as an "entry mechanism" for placing trades, but rather a filter mechanism to help you determine which currency pairs might be best for a particular trading strategy that you intend to utilize. Once you have selected a currency pair, or set of currency pairs, then you would go to the individual currency pair charts and perform your usual technical analysis.
The Dashboard can be placed on any chart or timeframe. In the inputs you can select the timeframe you would like to use for the WSI calculations.
For example, if you are on a 1 hour chart and want to see a higher level view of the market, you might set the WSI Dashboard timeframe to Daily.
You can also change the WSI Period, which controls how many candles are used to calculate the strength for each currency.
Here is the 200 Period Daily WSI Dashboard:
發行說明
There was an error in the code. It has been fixed now and should work as expected.受保護腳本
此腳本以閉源形式發佈。 不過,您可以自由使用,沒有任何限制 — 點擊此處了解更多。
免責聲明
這些資訊和出版物並非旨在提供,也不構成TradingView提供或認可的任何形式的財務、投資、交易或其他類型的建議或推薦。請閱讀使用條款以了解更多資訊。
受保護腳本
此腳本以閉源形式發佈。 不過,您可以自由使用,沒有任何限制 — 點擊此處了解更多。
免責聲明
這些資訊和出版物並非旨在提供,也不構成TradingView提供或認可的任何形式的財務、投資、交易或其他類型的建議或推薦。請閱讀使用條款以了解更多資訊。