OPEN-SOURCE SCRIPT
已更新 Momentum (80) + ATR (14)
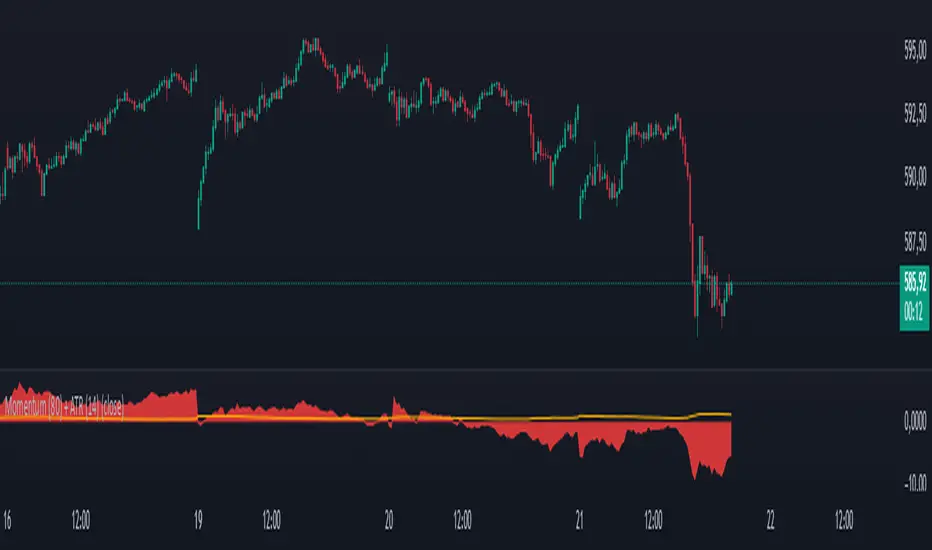
his indicator combines two essential technical analysis tools in a single panel for enhanced market insight:
🔹 Momentum (80 periods): Measures the difference between the current price and the price 80 bars ago. Displayed as a semi-transparent filled area, it helps to visually identify shifts in price momentum over a longer timeframe.
🔸 ATR (Average True Range, 14 periods): Shown as a fine orange line, the ATR represents average market volatility over 14 periods, highlighting phases of calm or increased price fluctuations.
By viewing both momentum and volatility simultaneously, traders can better assess trend strength and market conditions, improving decision-making across assets such as stocks, forex, and cryptocurrencies.
✅ Suitable for all asset types
✅ Complements other indicators like RSI, MACD, and Bollinger Bands
✅ Categorized under Momentum & Volatility indicators
發行說明
📈 Momentum (80) + ATR (14) IndicatorThis custom indicator combines two essential technical tools—Momentum and Average True Range (ATR)—to help traders better interpret both market directional strength and volatility conditions in a single view.
🔹 Momentum (80)
The momentum component calculates the difference between the current closing price and the closing price 80 periods ago:
Momentum = Close - Close[80].
This long lookback period helps to smooth out noise and highlight sustained movements in price. The result is plotted as a filled area, visually emphasizing strong upward or downward momentum. It’s especially useful for identifying emerging trends or the weakening of existing ones.
🔹 ATR (14)
The Average True Range (ATR), using a standard 14-period setting, is plotted as a single line. It provides a real-time measure of market volatility by calculating the average range between high and low prices, adjusted for gaps.
A dynamic label shows the current ATR value on the latest bar, helping traders quickly assess whether volatility is increasing or contracting—key for position sizing and risk management.
開源腳本
秉持TradingView一貫精神,這個腳本的創作者將其設為開源,以便交易者檢視並驗證其功能。向作者致敬!您可以免費使用此腳本,但請注意,重新發佈代碼需遵守我們的社群規範。
免責聲明
這些資訊和出版物並非旨在提供,也不構成TradingView提供或認可的任何形式的財務、投資、交易或其他類型的建議或推薦。請閱讀使用條款以了解更多資訊。
開源腳本
秉持TradingView一貫精神,這個腳本的創作者將其設為開源,以便交易者檢視並驗證其功能。向作者致敬!您可以免費使用此腳本,但請注意,重新發佈代碼需遵守我們的社群規範。
免責聲明
這些資訊和出版物並非旨在提供,也不構成TradingView提供或認可的任何形式的財務、投資、交易或其他類型的建議或推薦。請閱讀使用條款以了解更多資訊。