OPEN-SOURCE SCRIPT
Jackson Hole Meetings - Lines and Labels
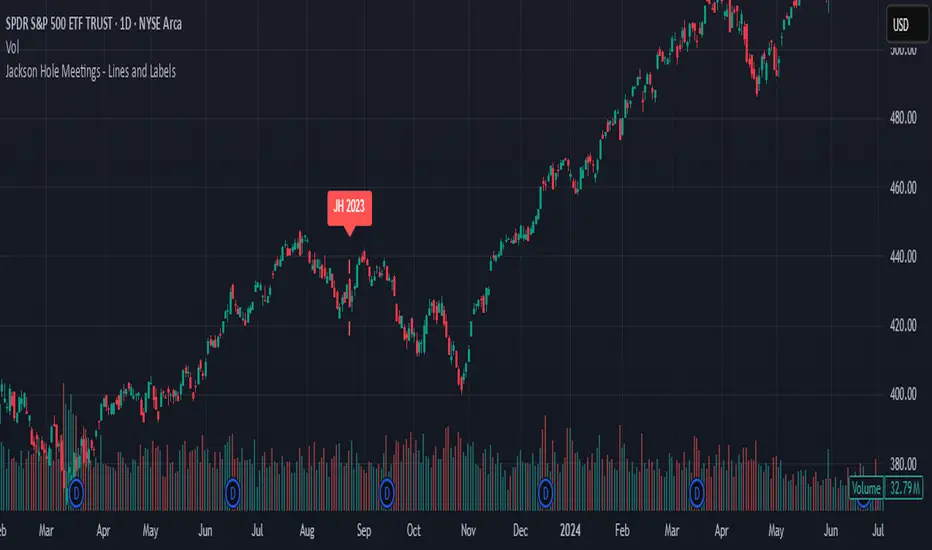
This TradingView Pine Script indicator marks the dates of the Federal Reserve’s annual Jackson Hole Economic Symposium meetings on your chart. For each meeting date from 2020 through 2025, it draws a red dashed vertical line directly on the corresponding daily bar. Additionally, it places a label above the bar indicating the year of the meeting (e.g., "JH 2025").
Features:
Marks all known Jackson Hole meeting dates from 2020 to 2025.
Draws a vertical dashed line on each meeting day for clear visual identification.
Displays a label above the candle with the meeting year.
Works best on daily timeframe charts.
Helps traders quickly spot potential market-moving events related to Jackson Hole meetings.
Use this tool to visually correlate price action with these key Federal Reserve events and enhance your trading analysis.
開源腳本
秉持TradingView一貫精神,這個腳本的創作者將其設為開源,以便交易者檢視並驗證其功能。向作者致敬!您可以免費使用此腳本,但請注意,重新發佈代碼需遵守我們的社群規範。
免責聲明
這些資訊和出版物並非旨在提供,也不構成TradingView提供或認可的任何形式的財務、投資、交易或其他類型的建議或推薦。請閱讀使用條款以了解更多資訊。
開源腳本
秉持TradingView一貫精神,這個腳本的創作者將其設為開源,以便交易者檢視並驗證其功能。向作者致敬!您可以免費使用此腳本,但請注意,重新發佈代碼需遵守我們的社群規範。
免責聲明
這些資訊和出版物並非旨在提供,也不構成TradingView提供或認可的任何形式的財務、投資、交易或其他類型的建議或推薦。請閱讀使用條款以了解更多資訊。