OPEN-SOURCE SCRIPT
Exponential Bollinger Bands
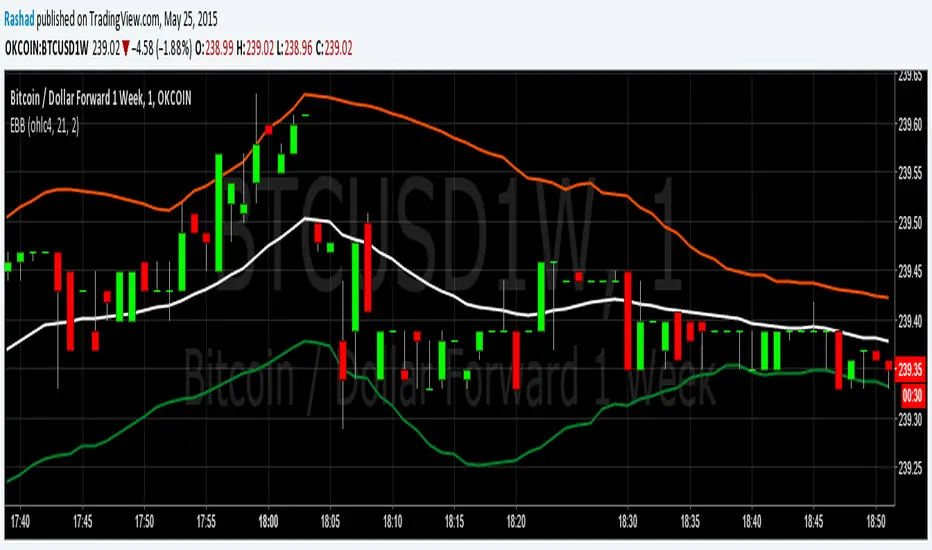
These Bollinger Bands are exponential because the variance is calculated using the exponential moving average, rather than just adding the normal standard deviation to the ema. This may be more useful because the exponential standard deviation should be more sensitive to near term increases or decreases in volatility.
Please do not forget that Bollinger Bands should always be combined with another method of analysis. Bollinger Bands just provide an easy way to gauge where the price could range in. At 2 standard deviations of a continuously random variable, more than 98% of data points are in this range. I am however going to test this in excel to get the average number of data points that stay in the range for Bitcoin. I will upload my findings when I complete that. Please monitor this description if your interested.
Please do not forget that Bollinger Bands should always be combined with another method of analysis. Bollinger Bands just provide an easy way to gauge where the price could range in. At 2 standard deviations of a continuously random variable, more than 98% of data points are in this range. I am however going to test this in excel to get the average number of data points that stay in the range for Bitcoin. I will upload my findings when I complete that. Please monitor this description if your interested.
開源腳本
秉持TradingView一貫精神,這個腳本的創作者將其設為開源,以便交易者檢視並驗證其功能。向作者致敬!您可以免費使用此腳本,但請注意,重新發佈代碼需遵守我們的社群規範。
免責聲明
這些資訊和出版物並非旨在提供,也不構成TradingView提供或認可的任何形式的財務、投資、交易或其他類型的建議或推薦。請閱讀使用條款以了解更多資訊。
免責聲明
這些資訊和出版物並非旨在提供,也不構成TradingView提供或認可的任何形式的財務、投資、交易或其他類型的建議或推薦。請閱讀使用條款以了解更多資訊。