OPEN-SOURCE SCRIPT
Inverse Fisher Z-Score
Introduction
The inverse fisher transform or hyperbolic tangent function is a type os sigmoid function (sometime called squashing function), those types of functions can rescale a result in a certain range and are widely used in artificial intelligence. More in depth the fisher transform can make the correlation coefficient of a time series normally distributed, in practice if you apply the fisher transform to the correlation coefficient between a time series and a linear function you will end up with an estimate of the z-score of the time series. The inverse transform however can do the contrary, it can take the z-score and transform it into a rough estimate of the correlation coefficient, if your z-score is not smooth then you will have a non-smooth estimate of the correlation coefficient, that's quite nice no ?
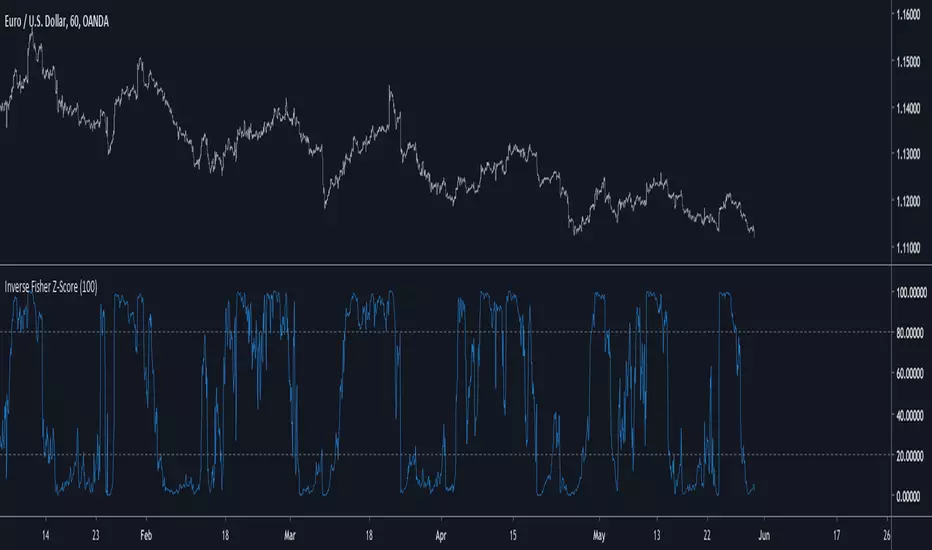
The Indicator
The inverse fisher transform of the z-score will produce results in a range of 1/-1, here however i will rescale in a range of 100/0 because its a standard range for oscillators in technical analysis. Values over 80 indicate an overbought market, under 20 an oversold market. The smooth option in the indicator settings will make the indicator use a linearly weighted moving average as input thus resulting in a smoother result.

The indicator with smooth option.
Conclusion
I presented a new oscillator indicator who use the inverse fisher transform of a z-score. Using the fisher transform and its inverse can give a new shape to your indicator, make sure to control the scale of your indicator before applying the fisher transform, the inverse transform should be applied to values in range of 1/-1 but you can use higher limits (2/-2,3/-3...), however remember that higher limits will approximate an heavy side step function (square shape). I hope you will find an use to this indicator.
Thanks for reading !
The inverse fisher transform or hyperbolic tangent function is a type os sigmoid function (sometime called squashing function), those types of functions can rescale a result in a certain range and are widely used in artificial intelligence. More in depth the fisher transform can make the correlation coefficient of a time series normally distributed, in practice if you apply the fisher transform to the correlation coefficient between a time series and a linear function you will end up with an estimate of the z-score of the time series. The inverse transform however can do the contrary, it can take the z-score and transform it into a rough estimate of the correlation coefficient, if your z-score is not smooth then you will have a non-smooth estimate of the correlation coefficient, that's quite nice no ?
The Indicator
The inverse fisher transform of the z-score will produce results in a range of 1/-1, here however i will rescale in a range of 100/0 because its a standard range for oscillators in technical analysis. Values over 80 indicate an overbought market, under 20 an oversold market. The smooth option in the indicator settings will make the indicator use a linearly weighted moving average as input thus resulting in a smoother result.
The indicator with smooth option.
Conclusion
I presented a new oscillator indicator who use the inverse fisher transform of a z-score. Using the fisher transform and its inverse can give a new shape to your indicator, make sure to control the scale of your indicator before applying the fisher transform, the inverse transform should be applied to values in range of 1/-1 but you can use higher limits (2/-2,3/-3...), however remember that higher limits will approximate an heavy side step function (square shape). I hope you will find an use to this indicator.
Thanks for reading !
開源腳本
秉持TradingView一貫精神,這個腳本的創作者將其設為開源,以便交易者檢視並驗證其功能。向作者致敬!您可以免費使用此腳本,但請注意,重新發佈代碼需遵守我們的社群規範。
Check out the indicators we are making at luxalgo: tradingview.com/u/LuxAlgo/
"My heart is so loud that I can't hear the fireworks"
"My heart is so loud that I can't hear the fireworks"
免責聲明
這些資訊和出版物並非旨在提供,也不構成TradingView提供或認可的任何形式的財務、投資、交易或其他類型的建議或推薦。請閱讀使用條款以了解更多資訊。