INVITE-ONLY SCRIPT
已更新 TradeChartist TrendRider
™TradeChartist TrendRider is an exceptionally beautiful and a functional indicator that does exactly what it says on the tin. The indicator rides the trend based on Momentum, Volatility, detecting critical zones of Support and Resistance along the way, which helps the indicator find the right trend to ride, plotting Trend Markers and Trade Signals based on only one piece of User input - TrendRider Type (Aggressive, Normal or Laid Back).
===================================================================================================================
What does ™TradeChartist TrendRider do?
The above features can be clearly seen on the 1 hr chart of GBP-USD below.

===================================================================================================================
How to create Alerts for ™TradeChartist TrendRider Long and Short Entries?
Alerts can be created for Long or Short entries using Once Per Bar as Bᴜʟʟs or Bᴇᴀʀs labels appear only on confirmation after bar close.
===================================================================================================================
Does the indicator include Stop Loss and Take Profit plots?
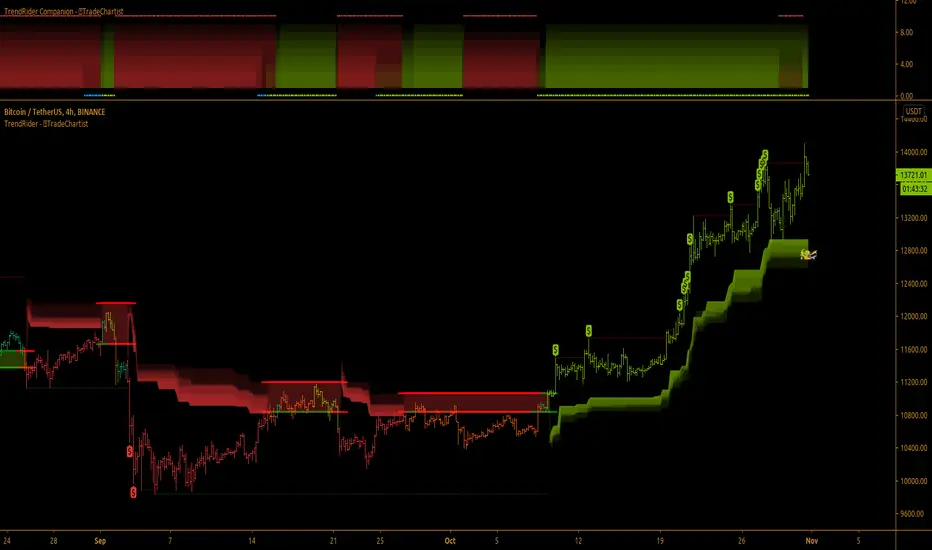
This script doesn't have Stop Loss and Take Profit plots, but it can be connected to ™TradeChartist Plug and Trade as Oscillatory signal ("TrendRider Signal") to generate Automatic Targets, set StopLoss and Take Profit plots and to create all types of alerts too. The 4hr chart of ICX-BTC below shows TrendRider connected to ™TradeChartist Plug and Trade.

===================================================================================================================
Does this indicator repaint?
No. This script doesn't repaint as it confirms its signals only after close above/below TrendRider's dynamic level and also uses security function to call higher time-frame values in the right way to avoid repainting. This can be verified using Bar Replay to check if the plots and fills stay in the same bar in real time as the Bar Replay.
===================================================================================================================
Example charts using TrendRider
===================================================================================================================
What does ™TradeChartist TrendRider do?
- ™TradeChartist TrendRider dynamically calculates Support and Resistance levels when riding a trend and uses these levels for confirmation on breach or fail (on a candle close), before reversing from the current trend it is riding. The change of trend is signalled using Bᴜʟʟs or Bᴇᴀʀs labels which are plotted upon confirmation of the Trend.
- TrendRider plots Bull and Bear Trend Markers on chart, which helps the user get a visual confirmation of the Trend.
- TrendRider also plots $ signs to show Take Profit Bars and also paints Trend strength on price bars based on the Color Scheme, if these options are enabled from the indicator settings.
The above features can be clearly seen on the 1 hr chart of GBP-USD below.
===================================================================================================================
How to create Alerts for ™TradeChartist TrendRider Long and Short Entries?
Alerts can be created for Long or Short entries using Once Per Bar as Bᴜʟʟs or Bᴇᴀʀs labels appear only on confirmation after bar close.
===================================================================================================================
Does the indicator include Stop Loss and Take Profit plots?
This script doesn't have Stop Loss and Take Profit plots, but it can be connected to ™TradeChartist Plug and Trade as Oscillatory signal ("TrendRider Signal") to generate Automatic Targets, set StopLoss and Take Profit plots and to create all types of alerts too. The 4hr chart of ICX-BTC below shows TrendRider connected to ™TradeChartist Plug and Trade.
===================================================================================================================
Does this indicator repaint?
No. This script doesn't repaint as it confirms its signals only after close above/below TrendRider's dynamic level and also uses security function to call higher time-frame values in the right way to avoid repainting. This can be verified using Bar Replay to check if the plots and fills stay in the same bar in real time as the Bar Replay.
===================================================================================================================
Example charts using TrendRider
- Daily chart of BTC-USD
===================================================================================================================- 15m chart of SPX
===================================================================================================================- 1hr chart of ADA-USDT
===================================================================================================================- 15m chart of XAU-USD
===================================================================================================================- 4hr chart of Dow Jones Industrial Average
===================================================================================================================
Best Practice: Test with different settings first using Paper Trades before trading with real money
===================================================================================================================
This is not a free to use indicator. Get in touch with me (PM me directly if you would like trial access to test the indicator)
Premium Scripts - Trial access and Information- Trial access offered on all Premium scripts.
- PM me directly to request trial access to the scripts or for more information.
===================================================================================================================
- 4hr chart of Dow Jones Industrial Average
- 15m chart of XAU-USD
- 1hr chart of ADA-USDT
- 15m chart of SPX
發行說明
Code Updated. Removed : Profit Taking bars as it causes memory usage issue. Plug and Trade can be used as an alternative for profit bars with $ sign.
發行說明
Code Optimised. Added - Source input - External source can also be connected like Ichimoku Base line, Moving Average etc.
發行說明
Profit Taking Bars added back to code.發行說明
Code Optimised僅限邀請腳本
僅作者批准的使用者才能訪問此腳本。您需要申請並獲得使用許可,通常需在付款後才能取得。更多詳情,請依照作者以下的指示操作,或直接聯絡TradeChartist。
TradingView不建議在未完全信任作者並了解其運作方式的情況下購買或使用腳本。您也可以在我們的社群腳本中找到免費的開源替代方案。
作者的說明
Get in touch with me if you would like access to my Premium scripts for a trial before deciding on lifetime access.
Telegram - @Trade_Chartist
Free Scripts - bit.ly/Free-Scripts
Telegram - @Trade_Chartist
Free Scripts - bit.ly/Free-Scripts
免責聲明
這些資訊和出版物並非旨在提供,也不構成TradingView提供或認可的任何形式的財務、投資、交易或其他類型的建議或推薦。請閱讀使用條款以了解更多資訊。
僅限邀請腳本
僅作者批准的使用者才能訪問此腳本。您需要申請並獲得使用許可,通常需在付款後才能取得。更多詳情,請依照作者以下的指示操作,或直接聯絡TradeChartist。
TradingView不建議在未完全信任作者並了解其運作方式的情況下購買或使用腳本。您也可以在我們的社群腳本中找到免費的開源替代方案。
作者的說明
Get in touch with me if you would like access to my Premium scripts for a trial before deciding on lifetime access.
Telegram - @Trade_Chartist
Free Scripts - bit.ly/Free-Scripts
Telegram - @Trade_Chartist
Free Scripts - bit.ly/Free-Scripts
免責聲明
這些資訊和出版物並非旨在提供,也不構成TradingView提供或認可的任何形式的財務、投資、交易或其他類型的建議或推薦。請閱讀使用條款以了解更多資訊。