PROTECTED SOURCE SCRIPT
已更新 V2 Indicator: A Unique Indicator
V2 Indicator: A Unique Indicator Combining Percentage Level and 5MWAP
V2 Indicator is an innovative trading tool developed by Najoomi Ji. It incorporates a combination of percentage levels and the 5MWAP (5 Moving Weighted Average Price) to provide valuable insights into market trends. The concept of percentage chart trading was inspired by the late Gurbachan Singh, the father of Najoomi Ji.
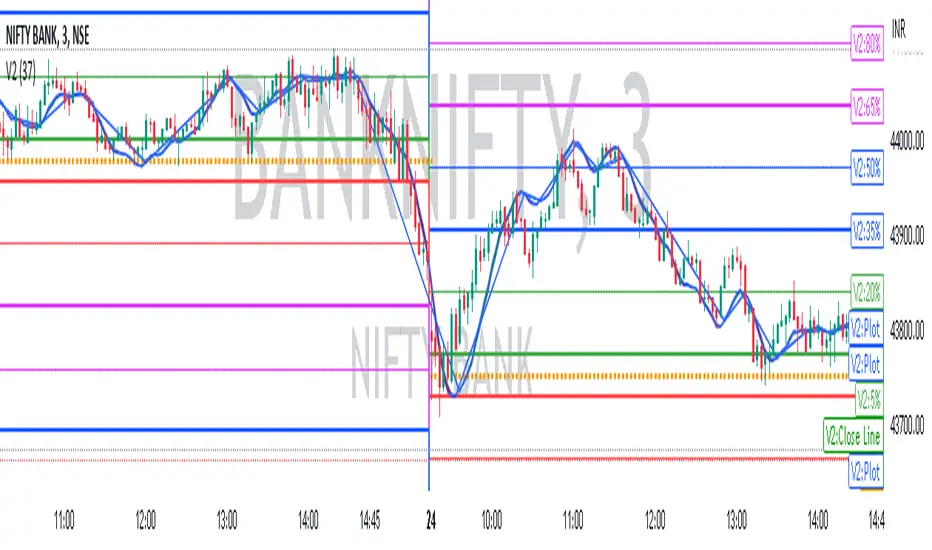
The primary rule of the V2 Indicator involves plotting lines on the chart based on the daily market open level and the percentage levels. At the start, a line is drawn 5% above and below the market open level on both sides. The indicator identifies the direction in which the market breaks out and prompts traders to enter the market accordingly.
To manage risk effectively, trailing stop-loss levels are employed in the V2 Indicator. These levels are set at significant percentage levels, such as 5%, 35%, 65%, and 95%. The market tends to respect these levels, making them crucial points for adjusting stop-loss orders.
Traders utilizing the V2 Indicator gain an advantage by closely monitoring the interplay between percentage levels and the 5MWAP. This indicator allows them to make informed decisions about market entry points, as well as effectively manage their trades by utilizing trailing stop-loss orders.
By combining the expertise of Najoomi Ji and the inspiration from Gurbachan Singh, the V2 Indicator offers a unique approach to trading, providing traders with a comprehensive tool for identifying market trends and managing risk effectively.
V2 Indicator is an innovative trading tool developed by Najoomi Ji. It incorporates a combination of percentage levels and the 5MWAP (5 Moving Weighted Average Price) to provide valuable insights into market trends. The concept of percentage chart trading was inspired by the late Gurbachan Singh, the father of Najoomi Ji.
The primary rule of the V2 Indicator involves plotting lines on the chart based on the daily market open level and the percentage levels. At the start, a line is drawn 5% above and below the market open level on both sides. The indicator identifies the direction in which the market breaks out and prompts traders to enter the market accordingly.
To manage risk effectively, trailing stop-loss levels are employed in the V2 Indicator. These levels are set at significant percentage levels, such as 5%, 35%, 65%, and 95%. The market tends to respect these levels, making them crucial points for adjusting stop-loss orders.
Traders utilizing the V2 Indicator gain an advantage by closely monitoring the interplay between percentage levels and the 5MWAP. This indicator allows them to make informed decisions about market entry points, as well as effectively manage their trades by utilizing trailing stop-loss orders.
By combining the expertise of Najoomi Ji and the inspiration from Gurbachan Singh, the V2 Indicator offers a unique approach to trading, providing traders with a comprehensive tool for identifying market trends and managing risk effectively.
發行說明
line color with changed for (dark screen) & 100% line added.發行說明
44 EMA COLOR CHANGE ADDED發行說明
trendline added with ema color changing modified 受保護腳本
此腳本以閉源形式發佈。 不過,您可以自由使用,沒有任何限制 — 點擊此處了解更多。
免責聲明
這些資訊和出版物並非旨在提供,也不構成TradingView提供或認可的任何形式的財務、投資、交易或其他類型的建議或推薦。請閱讀使用條款以了解更多資訊。
免責聲明
這些資訊和出版物並非旨在提供,也不構成TradingView提供或認可的任何形式的財務、投資、交易或其他類型的建議或推薦。請閱讀使用條款以了解更多資訊。