PROTECTED SOURCE SCRIPT
已更新 Rails [s3]
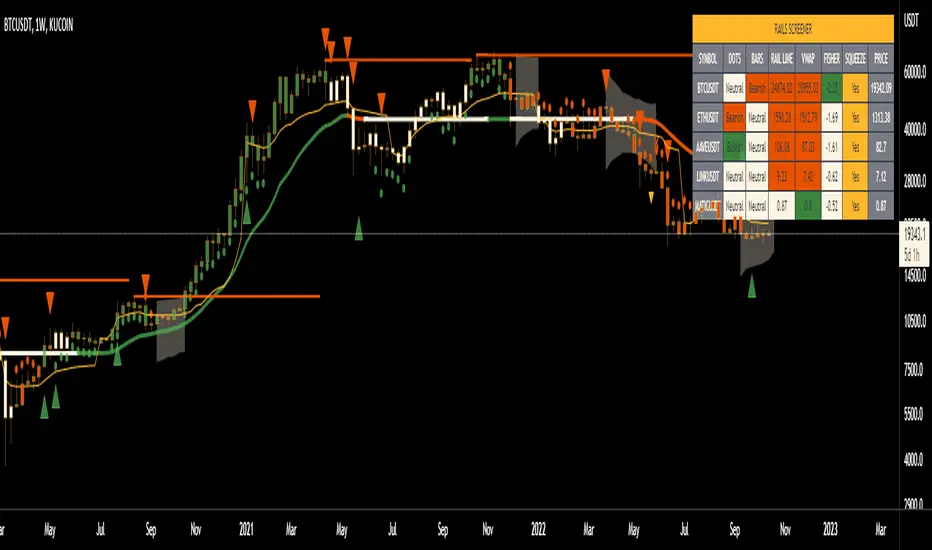
Centered around a Variable Moving Average. The Variable Moving Average (VMA) is a study that uses an Exponential Moving Average being able to automatically adjust its smoothing factor according to the market volatility. In addition to the VMA, the indicator displays breakouts in volume and when the Bollinger Bands are in a squeeze.
Dots = Microtrend
Triangles = Breakouts in Volume
X = Crossover of Moving Averages
Shaded "Cloud" = Bollinger Bands Squeeze
Alerts can be set for Bearish and Bullish strength (Volume Breakouts), Crossovers, and when Squeezes have started and ended.
Dots = Microtrend
Triangles = Breakouts in Volume
X = Crossover of Moving Averages
Shaded "Cloud" = Bollinger Bands Squeeze
Alerts can be set for Bearish and Bullish strength (Volume Breakouts), Crossovers, and when Squeezes have started and ended.
發行說明
Made UX changes.
發行說明
Added Murrey Math Lines Channel to indicator.
發行說明
Fixed shape location and allowed user input to turn on/off Murrey lines
發行說明
Refined Shape Offset
發行說明
Added exhaustion levels; set default value for exhaustion levels to on; set default value for Murrey lines to off
發行說明
Updated chart picture
發行說明
Fixed spelling error
發行說明
Tuned squeeze settings
發行說明
Updated alert messages and code optimized
發行說明
- Added Screener
- Added diamond symbol to forecast squeeze direction (still confirmed by volume breakout arrow)
發行說明
-Aesthetic changes
發行說明
- Added VWAP weighted for volatility- Added ability to see squeezes on higher TF than chart
- Changed normalized volume to show (bigger red/green triangles) whenever above 50 MA
受保護腳本
此腳本以閉源形式發佈。 不過,您可以自由使用,沒有任何限制 — 點擊此處了解更多。
免責聲明
這些資訊和出版物並非旨在提供,也不構成TradingView提供或認可的任何形式的財務、投資、交易或其他類型的建議或推薦。請閱讀使用條款以了解更多資訊。
受保護腳本
此腳本以閉源形式發佈。 不過,您可以自由使用,沒有任何限制 — 點擊此處了解更多。
免責聲明
這些資訊和出版物並非旨在提供,也不構成TradingView提供或認可的任何形式的財務、投資、交易或其他類型的建議或推薦。請閱讀使用條款以了解更多資訊。