PROTECTED SOURCE SCRIPT
DM Order Blocks
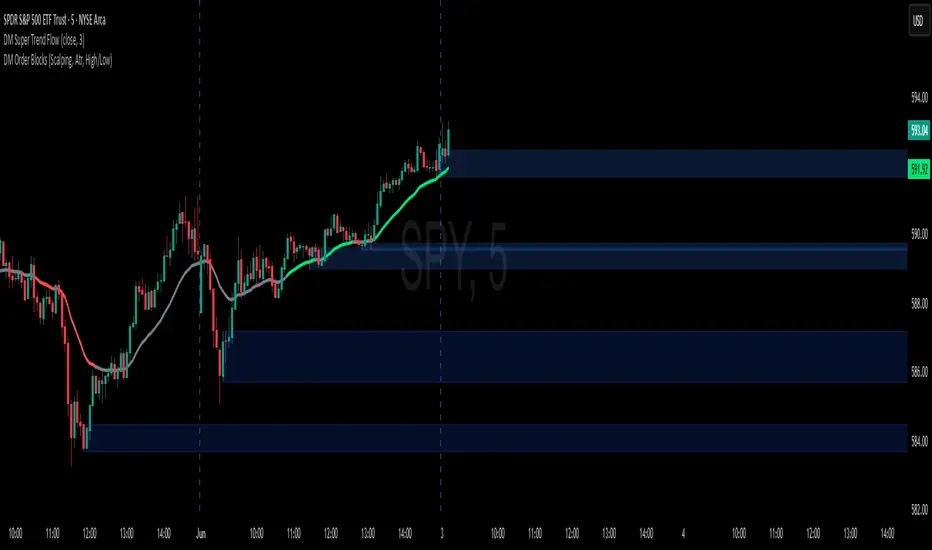
Bullish setup:
Wait for a bullish OB to form (price broke structure upward).
Wait for price to return into that blue box (mitigation).
Drop to a lower timeframe (e.g., from 5 min → 1 min) and look for:
Bullish engulfing candle
BOS / liquidity sweep inside OB
Enter long near the OB’s low or midpoint.
Stop loss below OB’s low.
Target previous highs or the next bearish OB above.
Bearish setup:
Wait for a bearish OB to form (price broke down).
Wait for price to retrace into the red box.
Look for a rejection candle or structure shift down.
Enter short near the OB’s high or midpoint.
Stop loss above the OB’s high.
Target previous lows or next bullish OB below.
Timeframe Combination Ideas
Style Chart Confirmation
Scalping 1 min or 3 min Entry on 15 sec or 30 sec
Day Trade 5 min or 15 min Entry on 1 min or 3 min
Swing 1 h Entry on 5 min or 15 min
Example Strategy
Example (Scalping):
On the 1-min chart, you see a new blue internal OB.
Price pulls back into it.
You see a small bullish engulfing candle at the OB’s bottom.
You enter long.
Stop loss just below the box.
Target 2×–3× risk reward (often around the previous swing high).
受保護腳本
此腳本以閉源形式發佈。 However, you can use it freely and without any limitations – learn more here.
免責聲明
The information and publications are not meant to be, and do not constitute, financial, investment, trading, or other types of advice or recommendations supplied or endorsed by TradingView. Read more in the Terms of Use.