INVITE-ONLY SCRIPT
已更新 Volume and Trend reversal scalping script
The Vtrend X script allows for both trend based and scalping trading entries, it gives you all the trend and reversal information at hand that is necessary. It works best in a trending market.
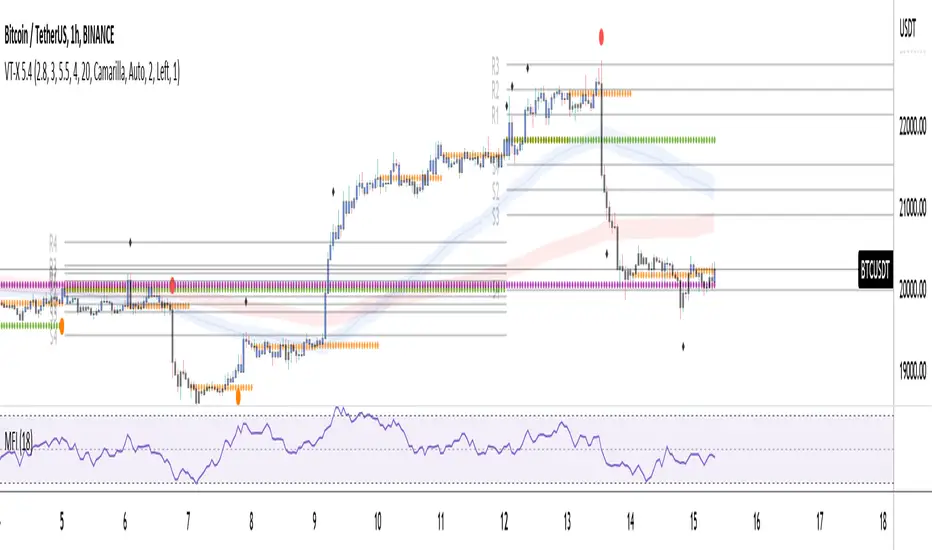
The fundamental part of the script, is the volume weighted bands in blue and red, which help determine the trend and dynamic support and resistance . The blue band is a shorter length than the red band.
When the blue band dips below the red band, this tells us there is a downtrend. And when the blue band is trending above the red band, this is bullish uptrend price action. You will be able to note price whatever the timeframe really respects these bands, and you can use that to your advantage flicking through the high and low timeframes on where price will go next, combined with your own support and resistance levels.

Combined with the candle colors, which change whether they close above or below the main trend colored line (shown below), help identify a change in price action and trend. This allows for low timeframe plays also.

The uptrend and downtrend cicle signals are shown in a few different colors. Green and red are with the trend and have met all conditions. Orange and purple are against the trend calculations, and Olive circles risky trades against all the filters used to calculate signals.

The reversal signals, are the diamond plots in black, These also represent take profit areas as well.

Another key feature is the Daily / Weekly / Monthly and Yearly open levels displayed as colored dots. A lot of the plays i take use the Daily opens as key levels to take a trade off.

The indicator is designed to give you key information, but be quite customisable as well to suit your exact trading style.
Recommended timeframes i use for this script; Weekly (for key liquidity areas), Trading on the Daily, 6h, 4h, 2h, 1h and 25 minutes.
Backtested Settings and Pairs;
Pair - Timeframe - Signals Inputs - Reversal Inputs - ATR Multiplier - MA Filter
BTCUSD - 1 hr - 3 - 2.8 - 5.5 - NA
ETHUSD - 1 hr - 4 - 2.8 - 5.5 - NA
USDCAD - 1 hr - 4 - 2.8 - 5.5 - NA
GBPUSD - 1 hr - 4 - 2.8 - 5.5 - NA
US30 - 1 hr - 4 - 2.8 - 5.5 - NA
BTCUSD - 4 hr - 2.5 - 2.5 - 3.5 - NA
BTCUSD - 25 mins - 5 - 2.5 - 5.5 - NA
The fundamental part of the script, is the volume weighted bands in blue and red, which help determine the trend and dynamic support and resistance . The blue band is a shorter length than the red band.
When the blue band dips below the red band, this tells us there is a downtrend. And when the blue band is trending above the red band, this is bullish uptrend price action. You will be able to note price whatever the timeframe really respects these bands, and you can use that to your advantage flicking through the high and low timeframes on where price will go next, combined with your own support and resistance levels.
Combined with the candle colors, which change whether they close above or below the main trend colored line (shown below), help identify a change in price action and trend. This allows for low timeframe plays also.
The uptrend and downtrend cicle signals are shown in a few different colors. Green and red are with the trend and have met all conditions. Orange and purple are against the trend calculations, and Olive circles risky trades against all the filters used to calculate signals.
The reversal signals, are the diamond plots in black, These also represent take profit areas as well.
Another key feature is the Daily / Weekly / Monthly and Yearly open levels displayed as colored dots. A lot of the plays i take use the Daily opens as key levels to take a trade off.
The indicator is designed to give you key information, but be quite customisable as well to suit your exact trading style.
Recommended timeframes i use for this script; Weekly (for key liquidity areas), Trading on the Daily, 6h, 4h, 2h, 1h and 25 minutes.
Backtested Settings and Pairs;
Pair - Timeframe - Signals Inputs - Reversal Inputs - ATR Multiplier - MA Filter
BTCUSD - 1 hr - 3 - 2.8 - 5.5 - NA
ETHUSD - 1 hr - 4 - 2.8 - 5.5 - NA
USDCAD - 1 hr - 4 - 2.8 - 5.5 - NA
GBPUSD - 1 hr - 4 - 2.8 - 5.5 - NA
US30 - 1 hr - 4 - 2.8 - 5.5 - NA
BTCUSD - 4 hr - 2.5 - 2.5 - 3.5 - NA
BTCUSD - 25 mins - 5 - 2.5 - 5.5 - NA
發行說明
overhaul僅限邀請腳本
僅作者批准的使用者才能訪問此腳本。您需要申請並獲得使用許可,通常需在付款後才能取得。更多詳情,請依照作者以下的指示操作,或直接聯絡vtrend-script。
TradingView不建議在未完全信任作者並了解其運作方式的情況下購買或使用腳本。您也可以在我們的社群腳本中找到免費的開源替代方案。
作者的說明
please visit vtrendscript.com to access
免責聲明
這些資訊和出版物並非旨在提供,也不構成TradingView提供或認可的任何形式的財務、投資、交易或其他類型的建議或推薦。請閱讀使用條款以了解更多資訊。
僅限邀請腳本
僅作者批准的使用者才能訪問此腳本。您需要申請並獲得使用許可,通常需在付款後才能取得。更多詳情,請依照作者以下的指示操作,或直接聯絡vtrend-script。
TradingView不建議在未完全信任作者並了解其運作方式的情況下購買或使用腳本。您也可以在我們的社群腳本中找到免費的開源替代方案。
作者的說明
please visit vtrendscript.com to access
免責聲明
這些資訊和出版物並非旨在提供,也不構成TradingView提供或認可的任何形式的財務、投資、交易或其他類型的建議或推薦。請閱讀使用條款以了解更多資訊。