OPEN-SOURCE SCRIPT
Elder Force Index Oscillator @shrilss
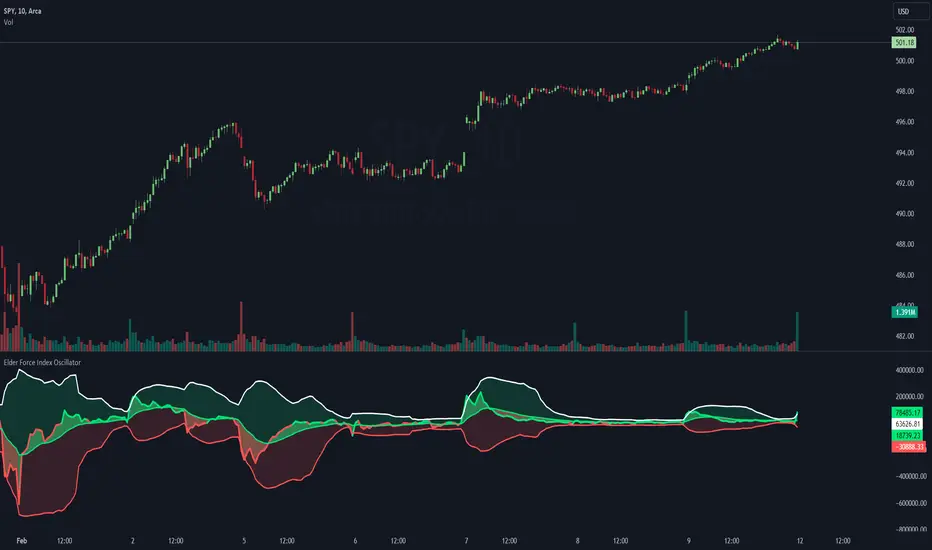
The "Elder Force Index Oscillator" is a comprehensive tool designed to assess the strength and direction of trends in the market. This indicator combines volume and price movement to provide traders with valuable insights into market dynamics.
Key Features:
- Volume Weighted: The oscillator considers both price changes and volume, emphasizing the significance of volume in confirming price movements.
- Trend Identification: Utilizing exponential moving averages (EMAs) and Bollinger Bands (BB), the indicator identifies potential trend reversals and continuations.
- Trend Strength Highlighting: With customizable options, the script highlights areas of strong and weak trend initiation, aiding traders in making informed decisions.
How It Works:
- Elder Force Index (EFI): The EFI is calculated as the EMA of price changes multiplied by volume. A positive value suggests buying pressure, while a negative value indicates selling pressure.
- EFI Moving Average (EFI MA): This smooths out the EFI, providing a clearer indication of trend direction.
- Bollinger Bands (BB): The upper and lower bands are calculated based on a specified number of standard deviations from the EFI's moving average, offering insights into potential overbought or oversold conditions.
開源腳本
秉持TradingView一貫精神,這個腳本的創作者將其設為開源,以便交易者檢視並驗證其功能。向作者致敬!您可以免費使用此腳本,但請注意,重新發佈代碼需遵守我們的社群規範。
免責聲明
這些資訊和出版物並非旨在提供,也不構成TradingView提供或認可的任何形式的財務、投資、交易或其他類型的建議或推薦。請閱讀使用條款以了解更多資訊。
免責聲明
這些資訊和出版物並非旨在提供,也不構成TradingView提供或認可的任何形式的財務、投資、交易或其他類型的建議或推薦。請閱讀使用條款以了解更多資訊。