OPEN-SOURCE SCRIPT
0900 and 1500 Candle Marker with Rectangles and Fibonacci
Welcome to the Indicator
// This tool is designed to help you analyze stock - crypto - or futures charts on TradingView by marking specific times - 9:00 AM and 3:00 PM (Eastern Time) - with colored rectangles and optional Fibonacci levels.
// It is perfect for spotting key moments in your trading day - like market opens or afternoon shifts - and understanding price ranges with simple lines and numbers.
// Whether you are new to trading or just want an easy way to visualize these times - this indicator is here to assist you.
//
// What It Does
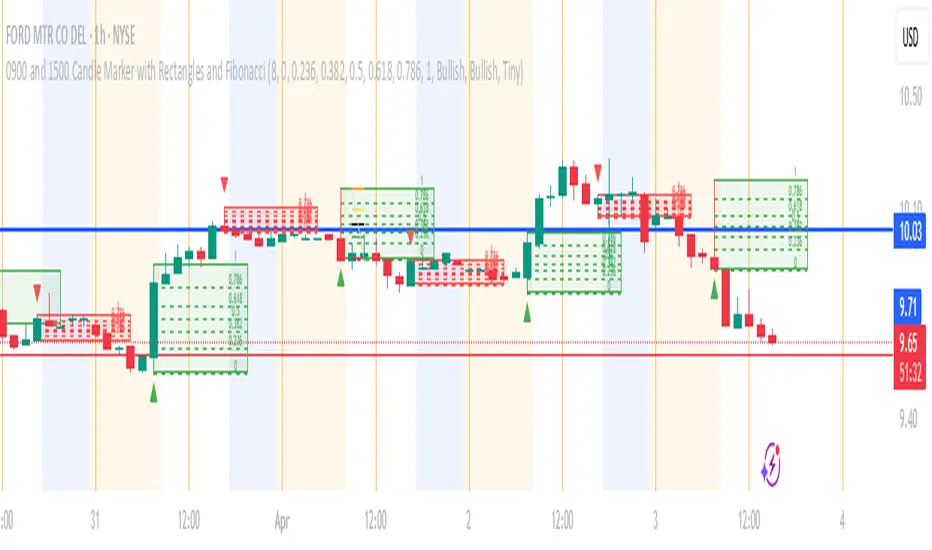
// - Draws a green rectangle at 9:00 AM and a red rectangle at 3:00 PM on your chart - based on Eastern Time (America/New_York timezone).
// - Adds dashed lines inside these rectangles (called Fibonacci levels) to show important price points - like 0.236 or 0.618 of the rectangle’s height.
// - Places numbers on these lines (e.g. "0.5") so you can see exactly what each level represents.
// - Works on different chart types (stocks - crypto - futures) and adjusts for futures trading hours if needed.
// - Is designed to work best on timeframes of 1 hour or shorter (like 1-hour - 30-minute - 15-minute - 5-minute - or 1-minute charts) - where you can see the 9:00 AM and 3:00 PM candles clearly.
// - Lets you customize what you see through a settings menu - like hiding some lines or changing colors.
YOU MAY NOT MONETIZE
ANY PORTION OF THIS CODE.
WE ARE ALL IN THIS THING TOGETHER TO WIN.
BE A BLESSING ONTO THE WORLD AND GIVE.:)
// This tool is designed to help you analyze stock - crypto - or futures charts on TradingView by marking specific times - 9:00 AM and 3:00 PM (Eastern Time) - with colored rectangles and optional Fibonacci levels.
// It is perfect for spotting key moments in your trading day - like market opens or afternoon shifts - and understanding price ranges with simple lines and numbers.
// Whether you are new to trading or just want an easy way to visualize these times - this indicator is here to assist you.
//
// What It Does
// - Draws a green rectangle at 9:00 AM and a red rectangle at 3:00 PM on your chart - based on Eastern Time (America/New_York timezone).
// - Adds dashed lines inside these rectangles (called Fibonacci levels) to show important price points - like 0.236 or 0.618 of the rectangle’s height.
// - Places numbers on these lines (e.g. "0.5") so you can see exactly what each level represents.
// - Works on different chart types (stocks - crypto - futures) and adjusts for futures trading hours if needed.
// - Is designed to work best on timeframes of 1 hour or shorter (like 1-hour - 30-minute - 15-minute - 5-minute - or 1-minute charts) - where you can see the 9:00 AM and 3:00 PM candles clearly.
// - Lets you customize what you see through a settings menu - like hiding some lines or changing colors.
YOU MAY NOT MONETIZE
ANY PORTION OF THIS CODE.
WE ARE ALL IN THIS THING TOGETHER TO WIN.
BE A BLESSING ONTO THE WORLD AND GIVE.:)
開源腳本
秉持TradingView一貫精神,這個腳本的創作者將其設為開源,以便交易者檢視並驗證其功能。向作者致敬!您可以免費使用此腳本,但請注意,重新發佈代碼需遵守我們的社群規範。
免責聲明
這些資訊和出版物並非旨在提供,也不構成TradingView提供或認可的任何形式的財務、投資、交易或其他類型的建議或推薦。請閱讀使用條款以了解更多資訊。
開源腳本
秉持TradingView一貫精神,這個腳本的創作者將其設為開源,以便交易者檢視並驗證其功能。向作者致敬!您可以免費使用此腳本,但請注意,重新發佈代碼需遵守我們的社群規範。
免責聲明
這些資訊和出版物並非旨在提供,也不構成TradingView提供或認可的任何形式的財務、投資、交易或其他類型的建議或推薦。請閱讀使用條款以了解更多資訊。